IR
IR WorkshopInside the CSIRT

Tool guide

Step by step walkthroughs for the four tools in every team instance. Get your credentials from the unlock page.

port 9000Case management

The incident recording, tracking, and management platform. Record incidents a cases, response phases as case tasks, and observables. Two teammates have org admin rights and the other two have read access.

Create a case
1Navigate to the Cases section
  • Log in to TheHive with your responder account.
  • At the top right, click the + Create Case button. You will be prompted to choose how to create the case.
TheHive screenshot
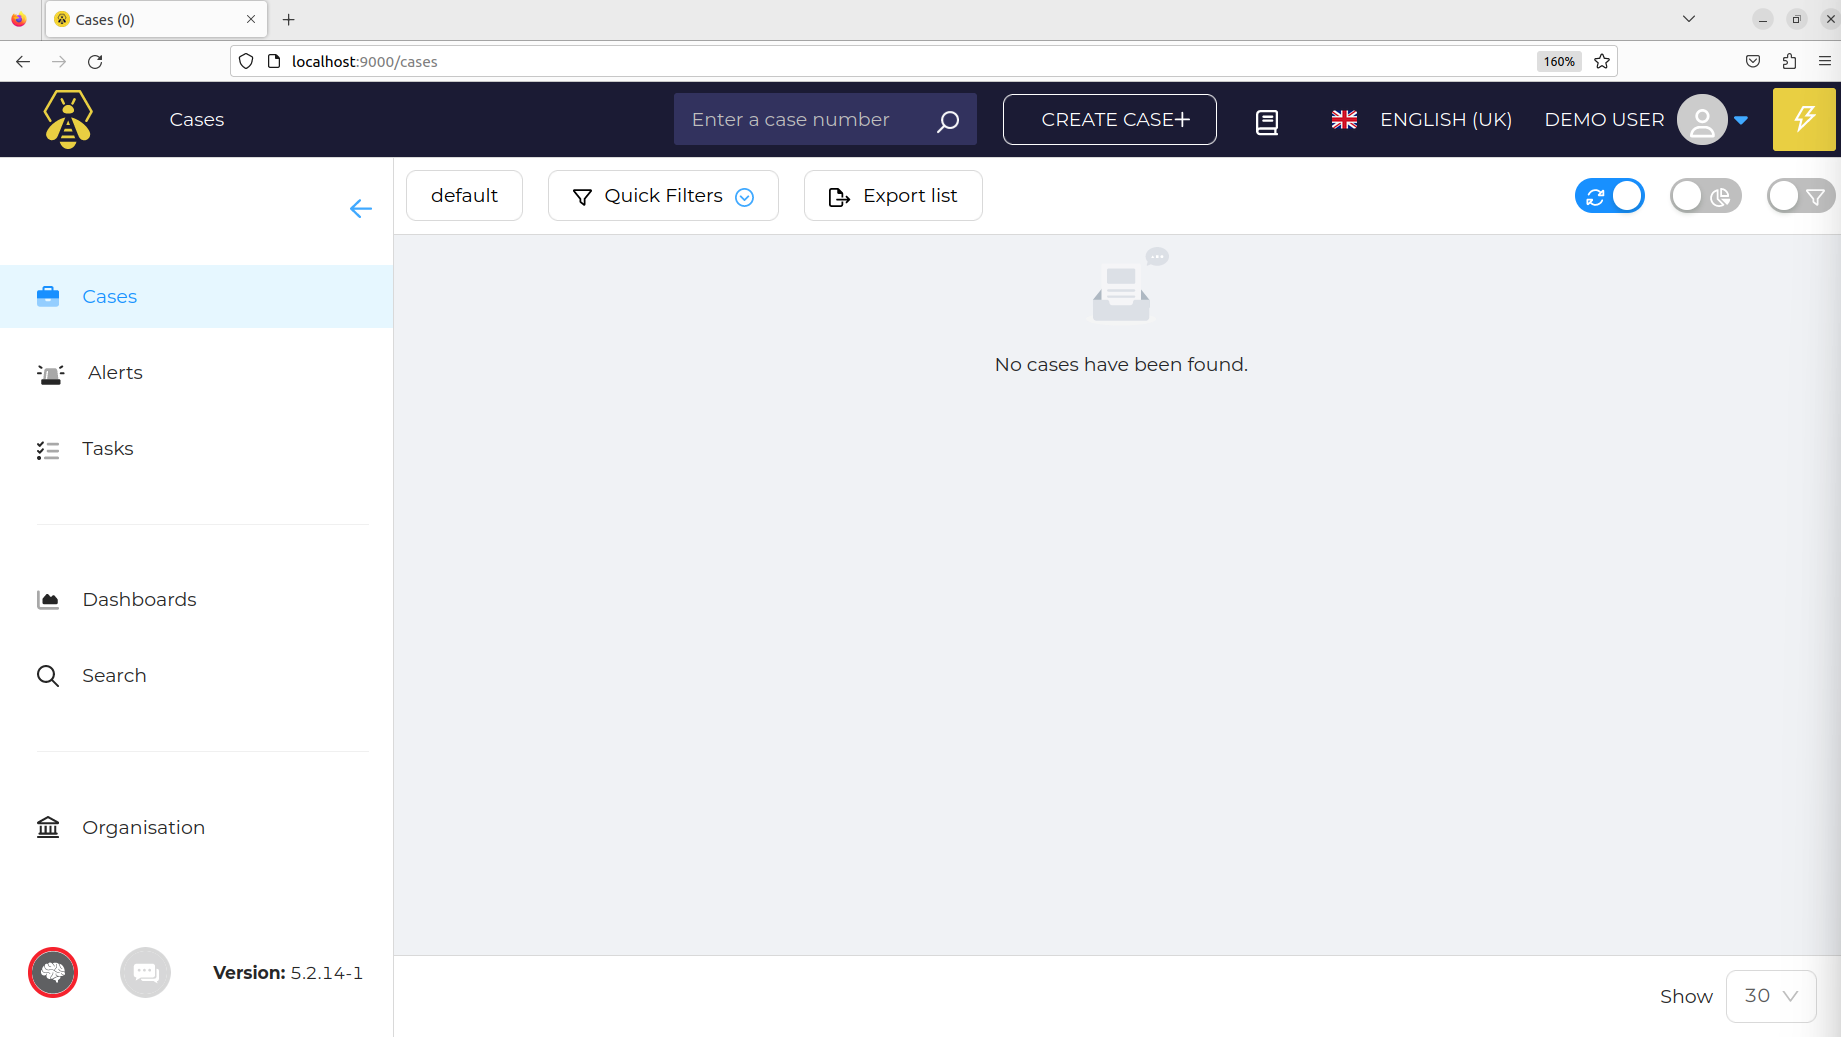
The Cases section right after you log in. The Create Case button sits at the top right, and the left menu has Cases, Alerts, Tasks and Organisation.
TheHive screenshot
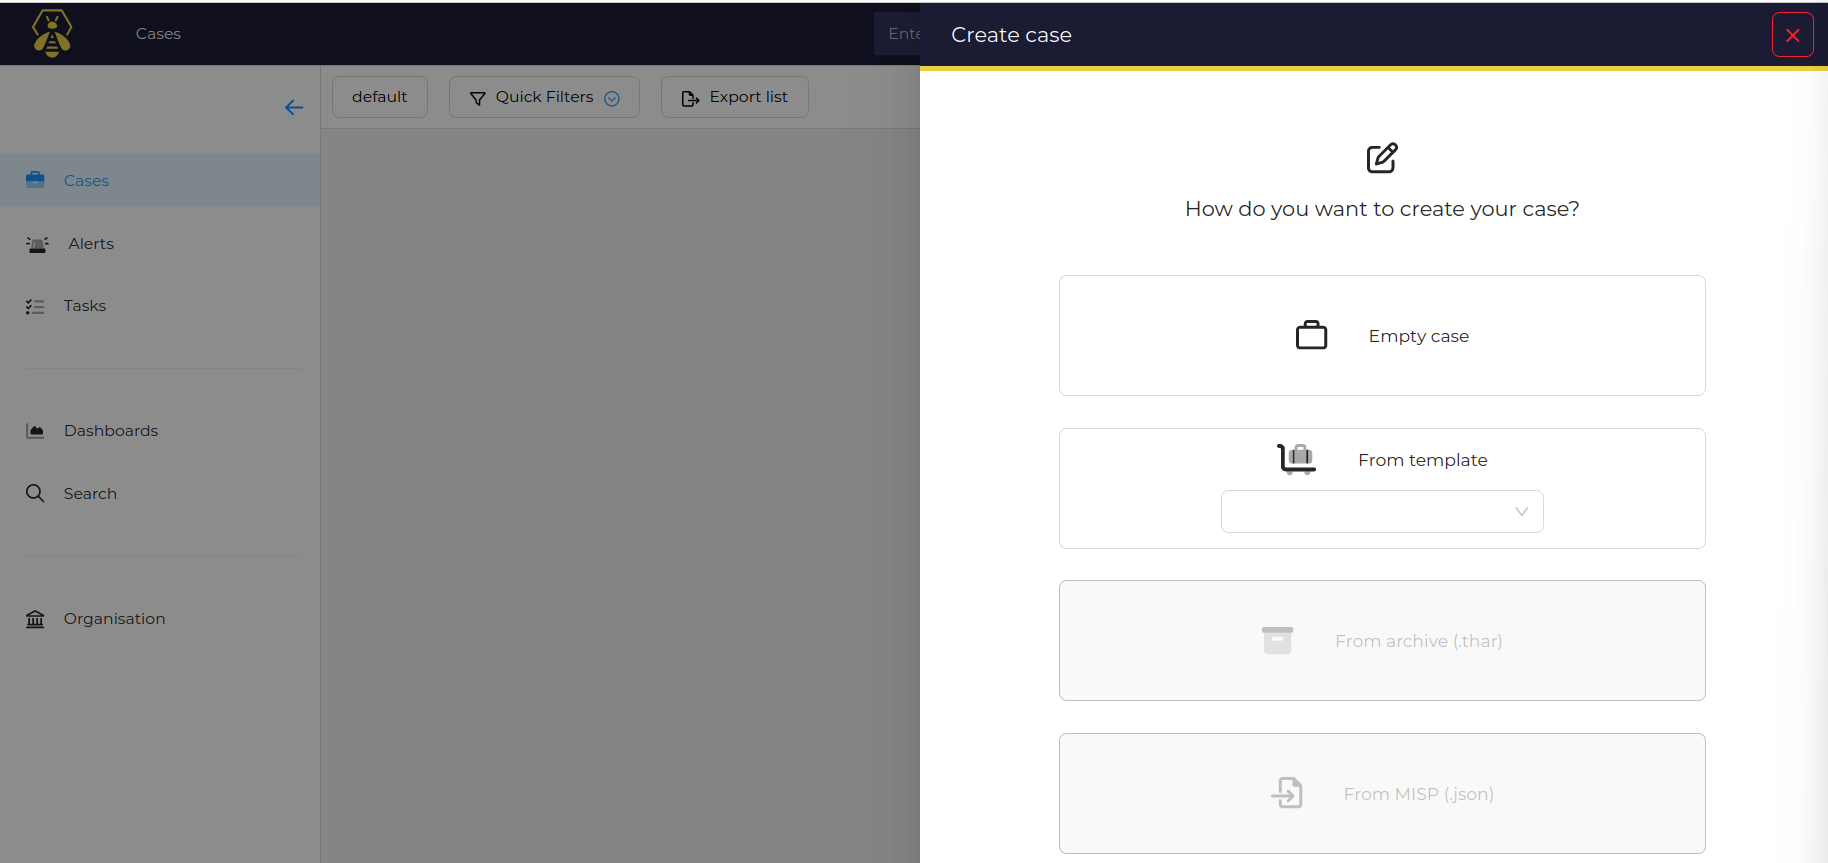
The panel that opens when you click Create Case. Choose Empty case (you can also start from a template).
2Fill in the case details and save
  • Choose the Empty case option and fill in the case details.
  • Click Confirm. The case is created and appears in the case list.
TheHive screenshot
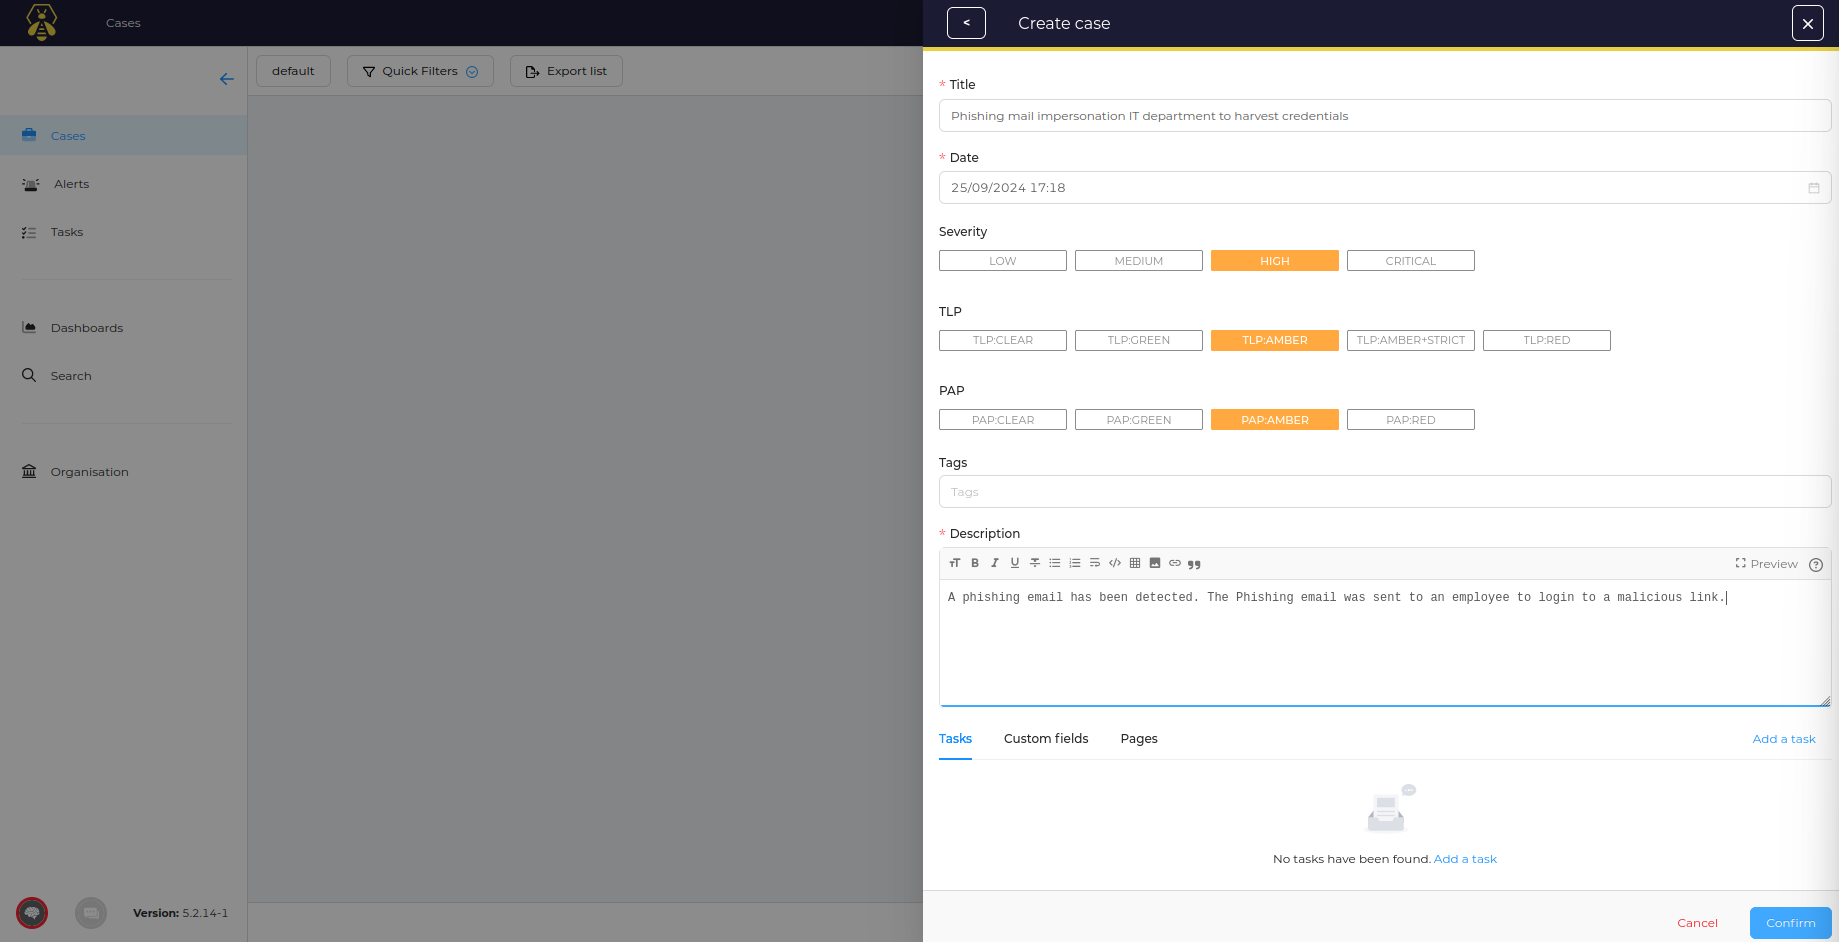
The empty case form. Give it a Title and Date, set Severity, TLP and PAP, add Tags, and write a Description, then Confirm.
TheHive screenshot
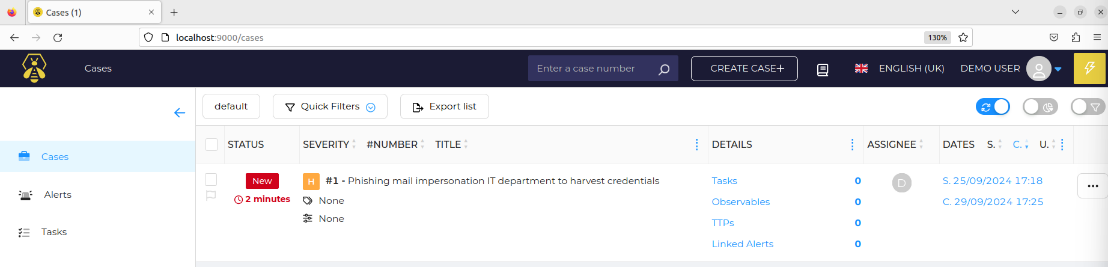
After you confirm, the new case appears in the Cases table with a New status.
TheHive screenshot
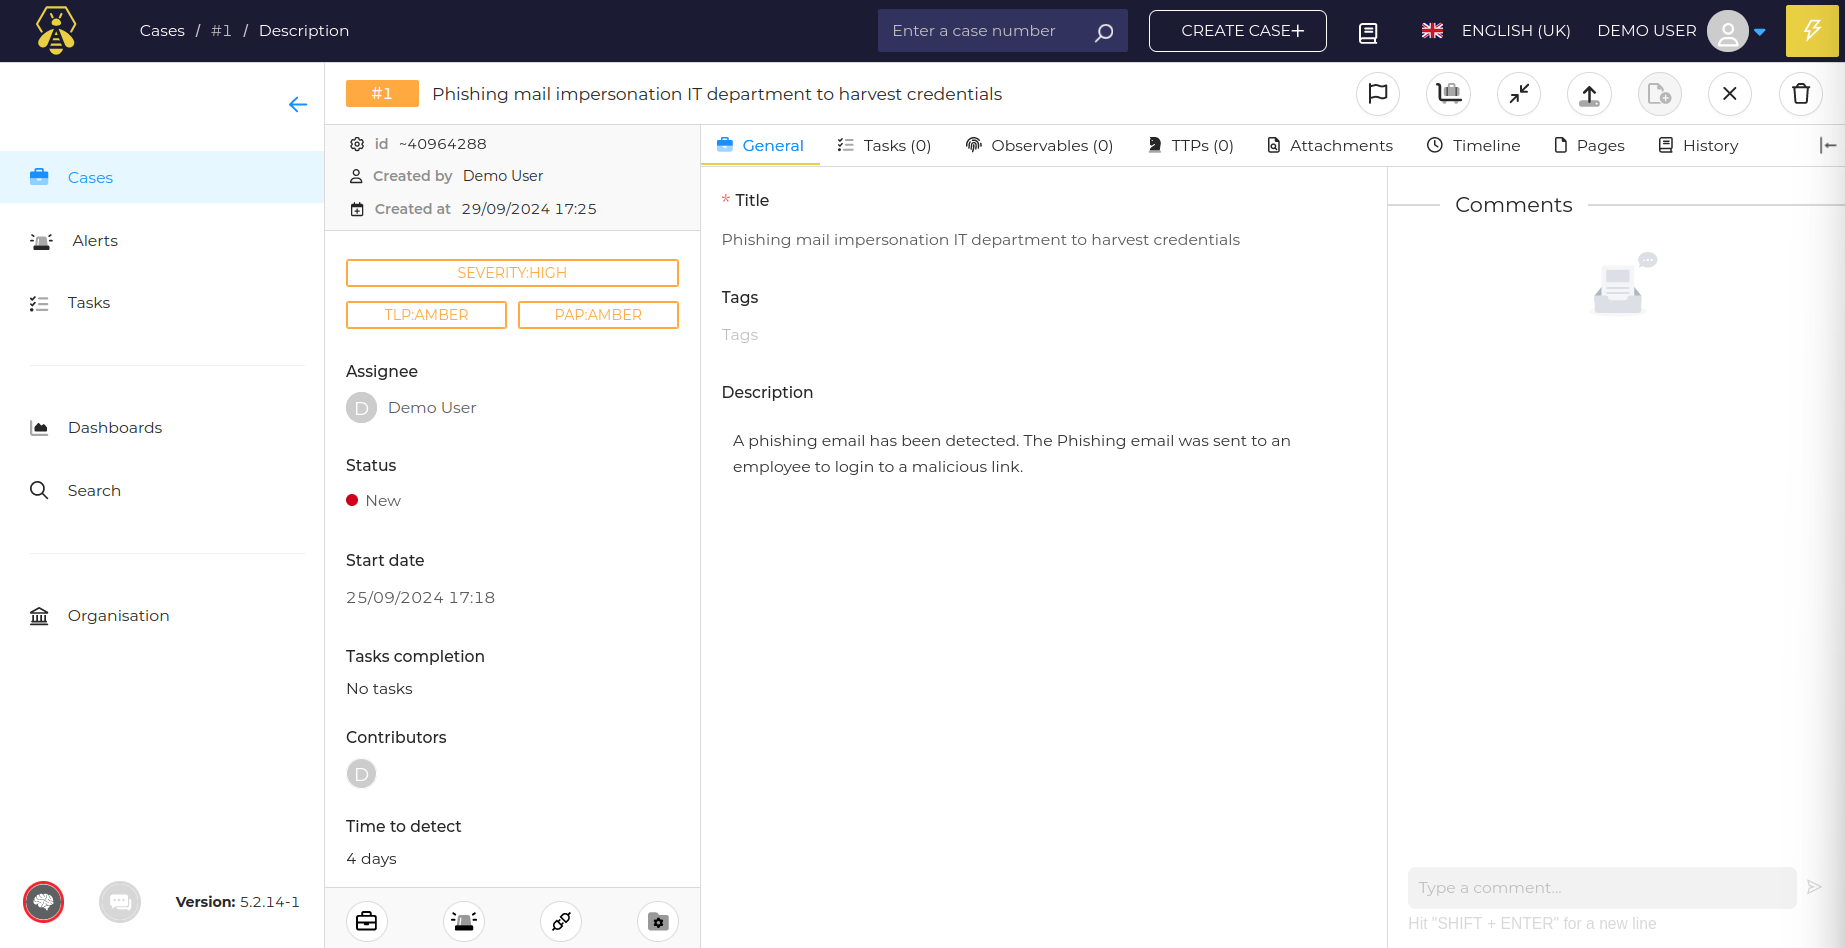
Opening the case shows its General view, with tabs across the top for Tasks, Observables, TTPs, Timeline and more.
Add case tasks
1Create tasks
  • While viewing the case, open the Tasks tab and click the add task icon.
  • Title: name the task after the NIST phase it covers (for example, Detection).
  • Description: summarise what your team did in that phase.
  • Assignee: the teammate responsible for it.
  • Due date: set one if the task is time sensitive.
  • Click Confirm.
TheHive screenshot
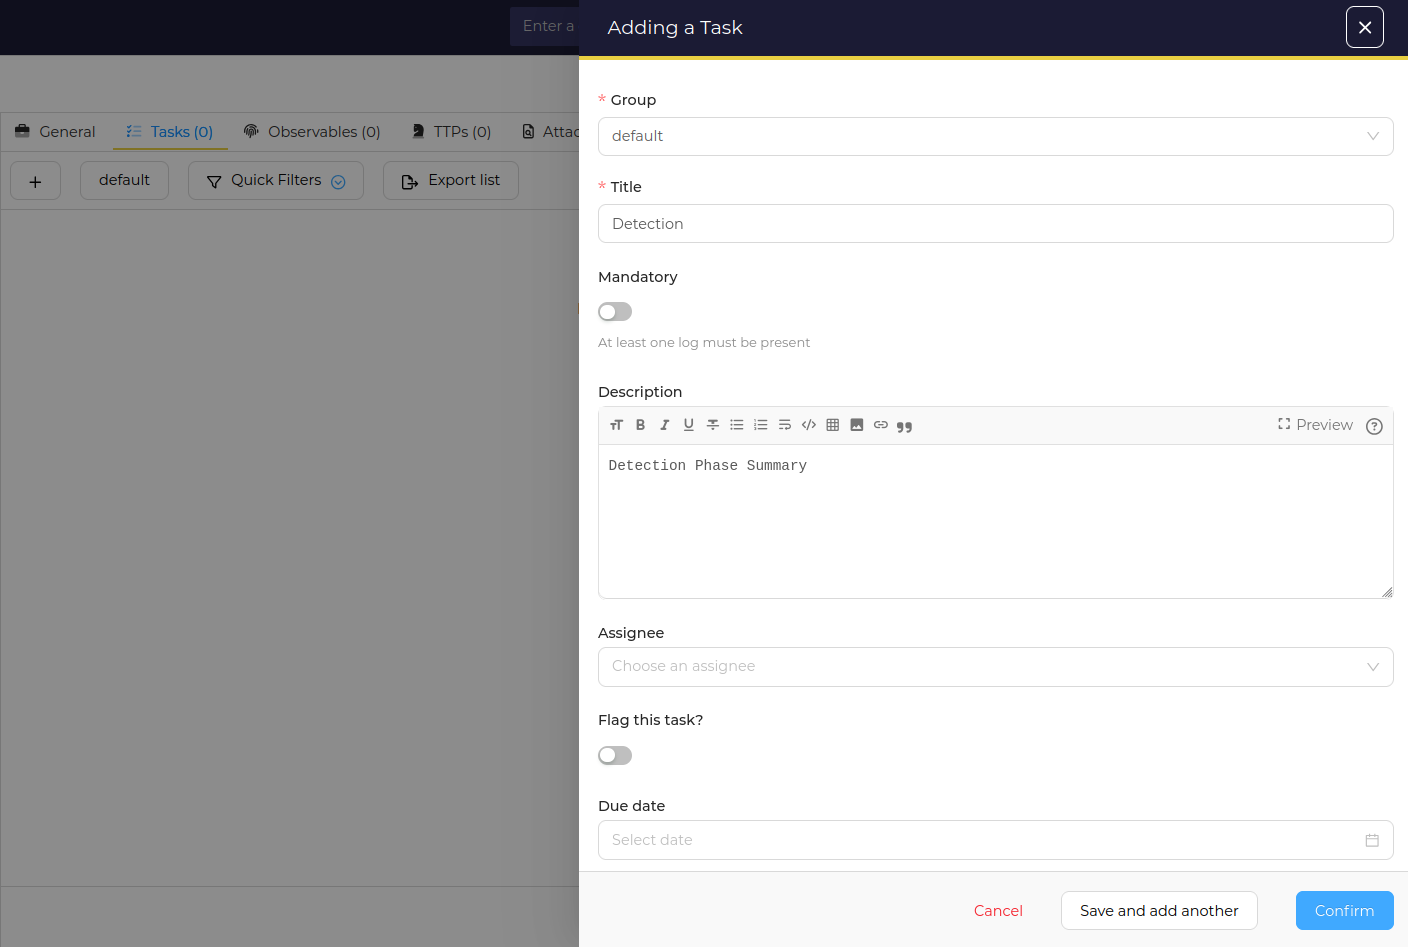
The Adding a Task panel. Here the task is titled Detection, one of the NIST phases, with a short phase summary in the Description.
2The task appears in the case
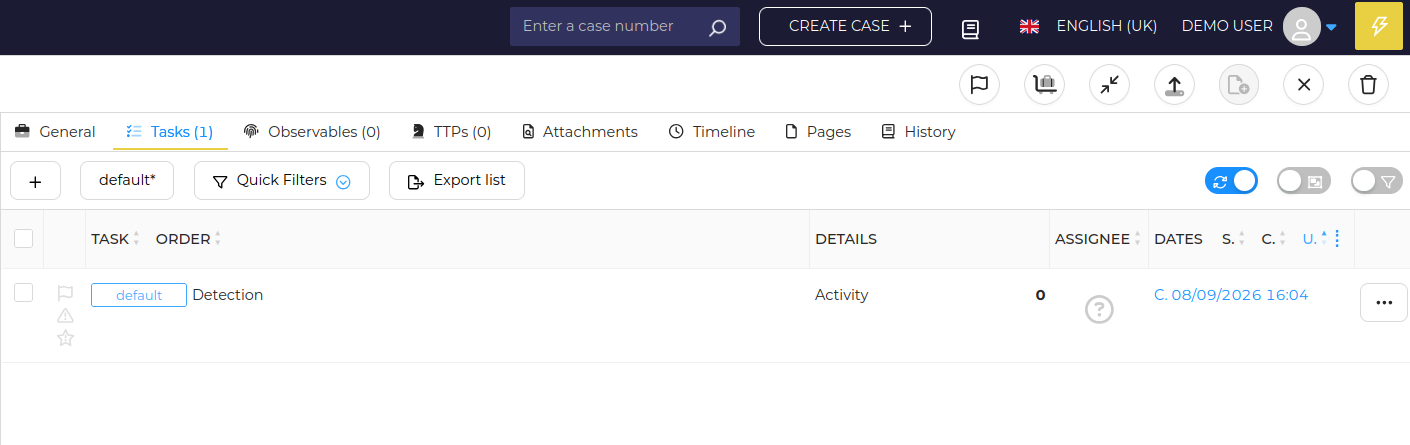
  • The task now shows under the Tasks tab, where you can track and update it.
TheHive screenshot
The Detection task listed under the Tasks tab.
3Assign the task to a team member
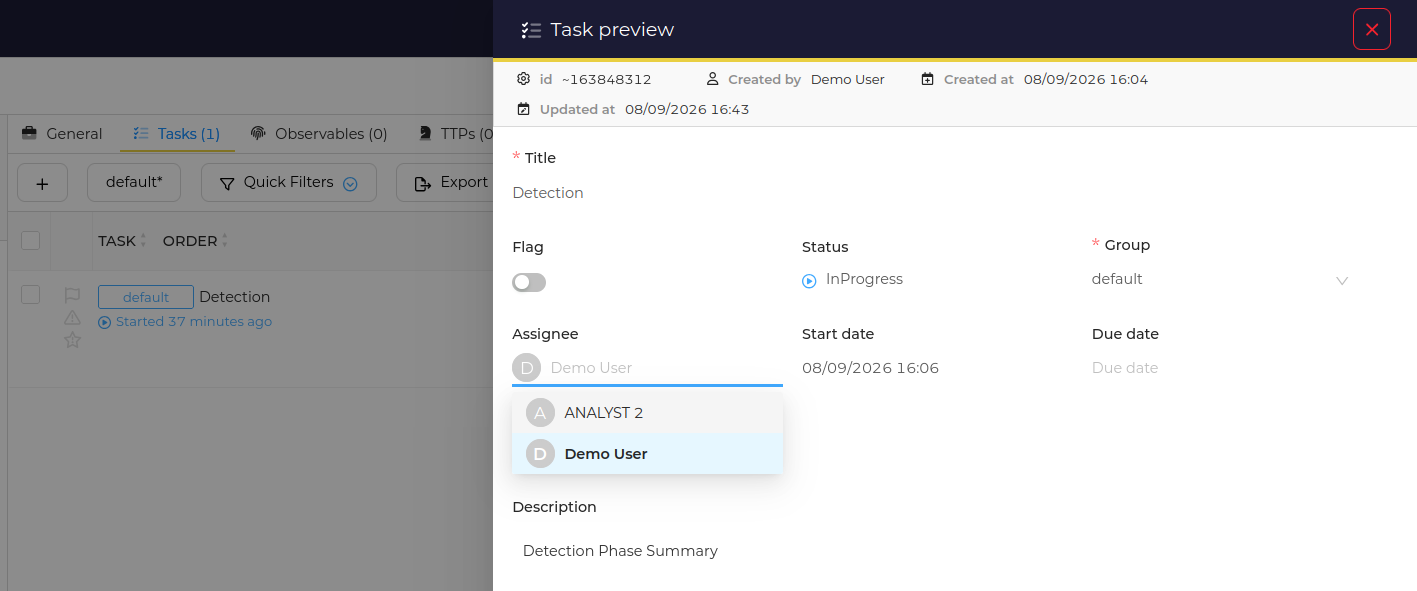
  • Click on Preview on a case task when you hover over it to open it in full and then click on Assignee, and select a team member to assign the task to
TheHive screenshot
The case task details in full
4Start the task
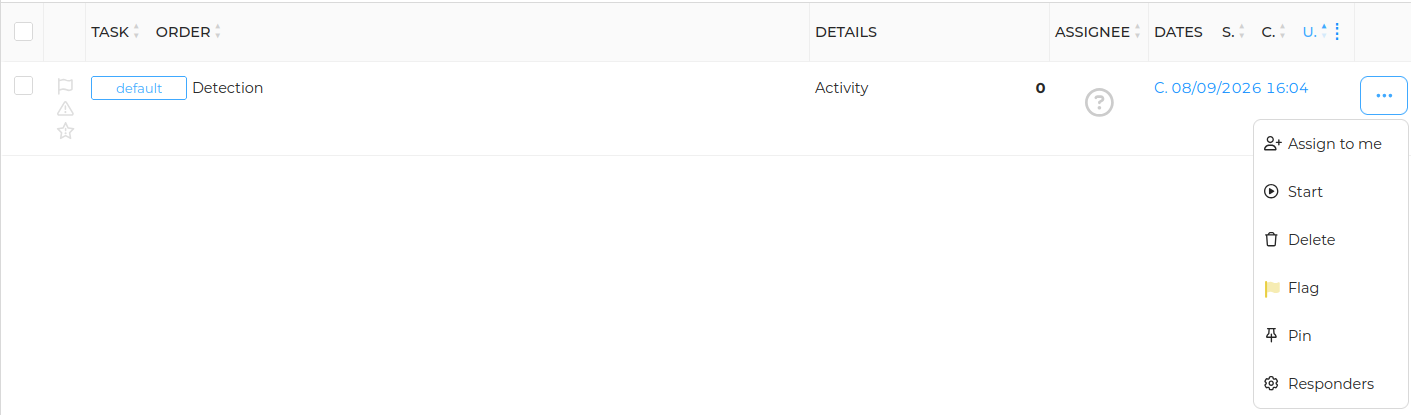
  • Open the task's ... menu and choose Start when you begin working on that phase.
TheHive screenshot
The task actions menu: Assign to me, Start, Delete, Flag, Pin and Responders.
5Close the task when the phase is done
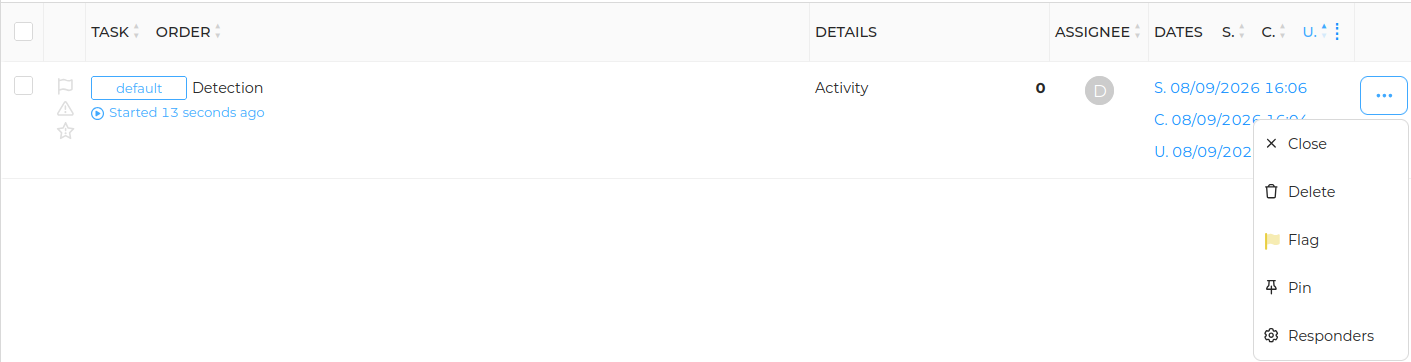
  • The task now shows as Started. When that phase is complete, make sure to open the ... menu again and choose Close before moving on to the next task.
TheHive screenshot
The task is now in progress (Started). The menu offers Close to mark that phase complete.
Add observables
1Add an observable
  • While viewing the case, open the Observables tab and click the add icon.
TheHive screenshot
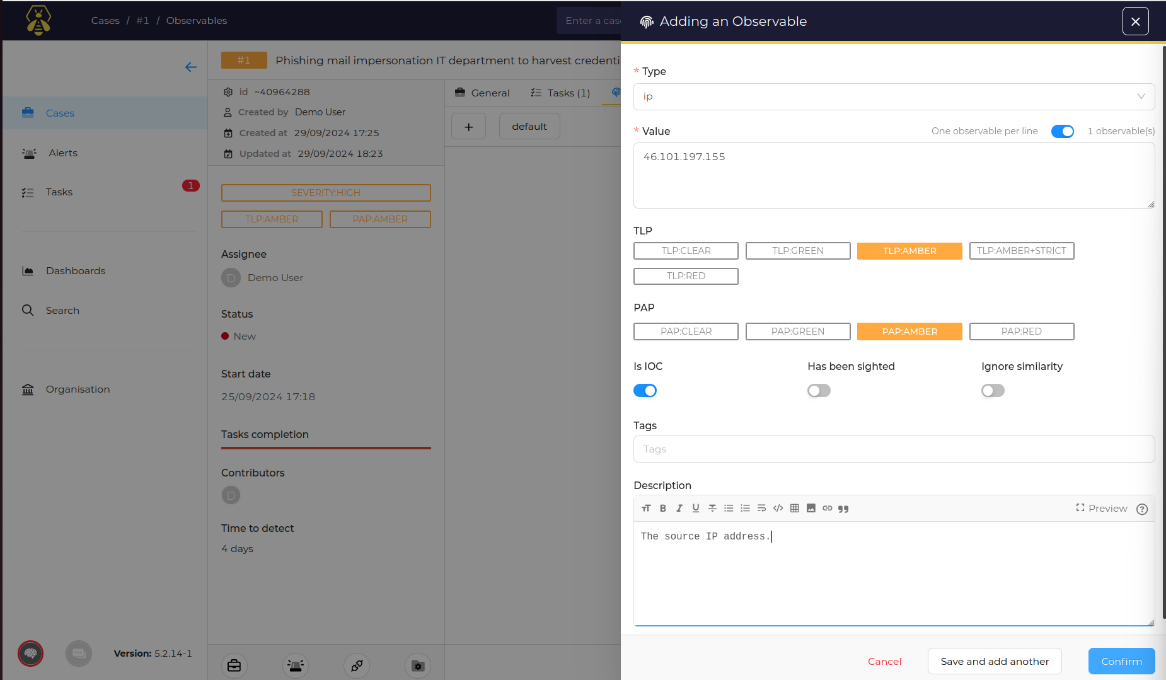
The Adding an Observable panel. Choose the Type, enter the Value, set TLP and PAP, flag it as an IOC if it is one, and add a Description.
2Fill in the observable details
  • Type: the kind of observable (IP address, URL, domain, file hash, email).
  • Value: the actual value, such as an IP address, a URL, or a file hash.
  • Description: a short description of the observable.
3Save the observable
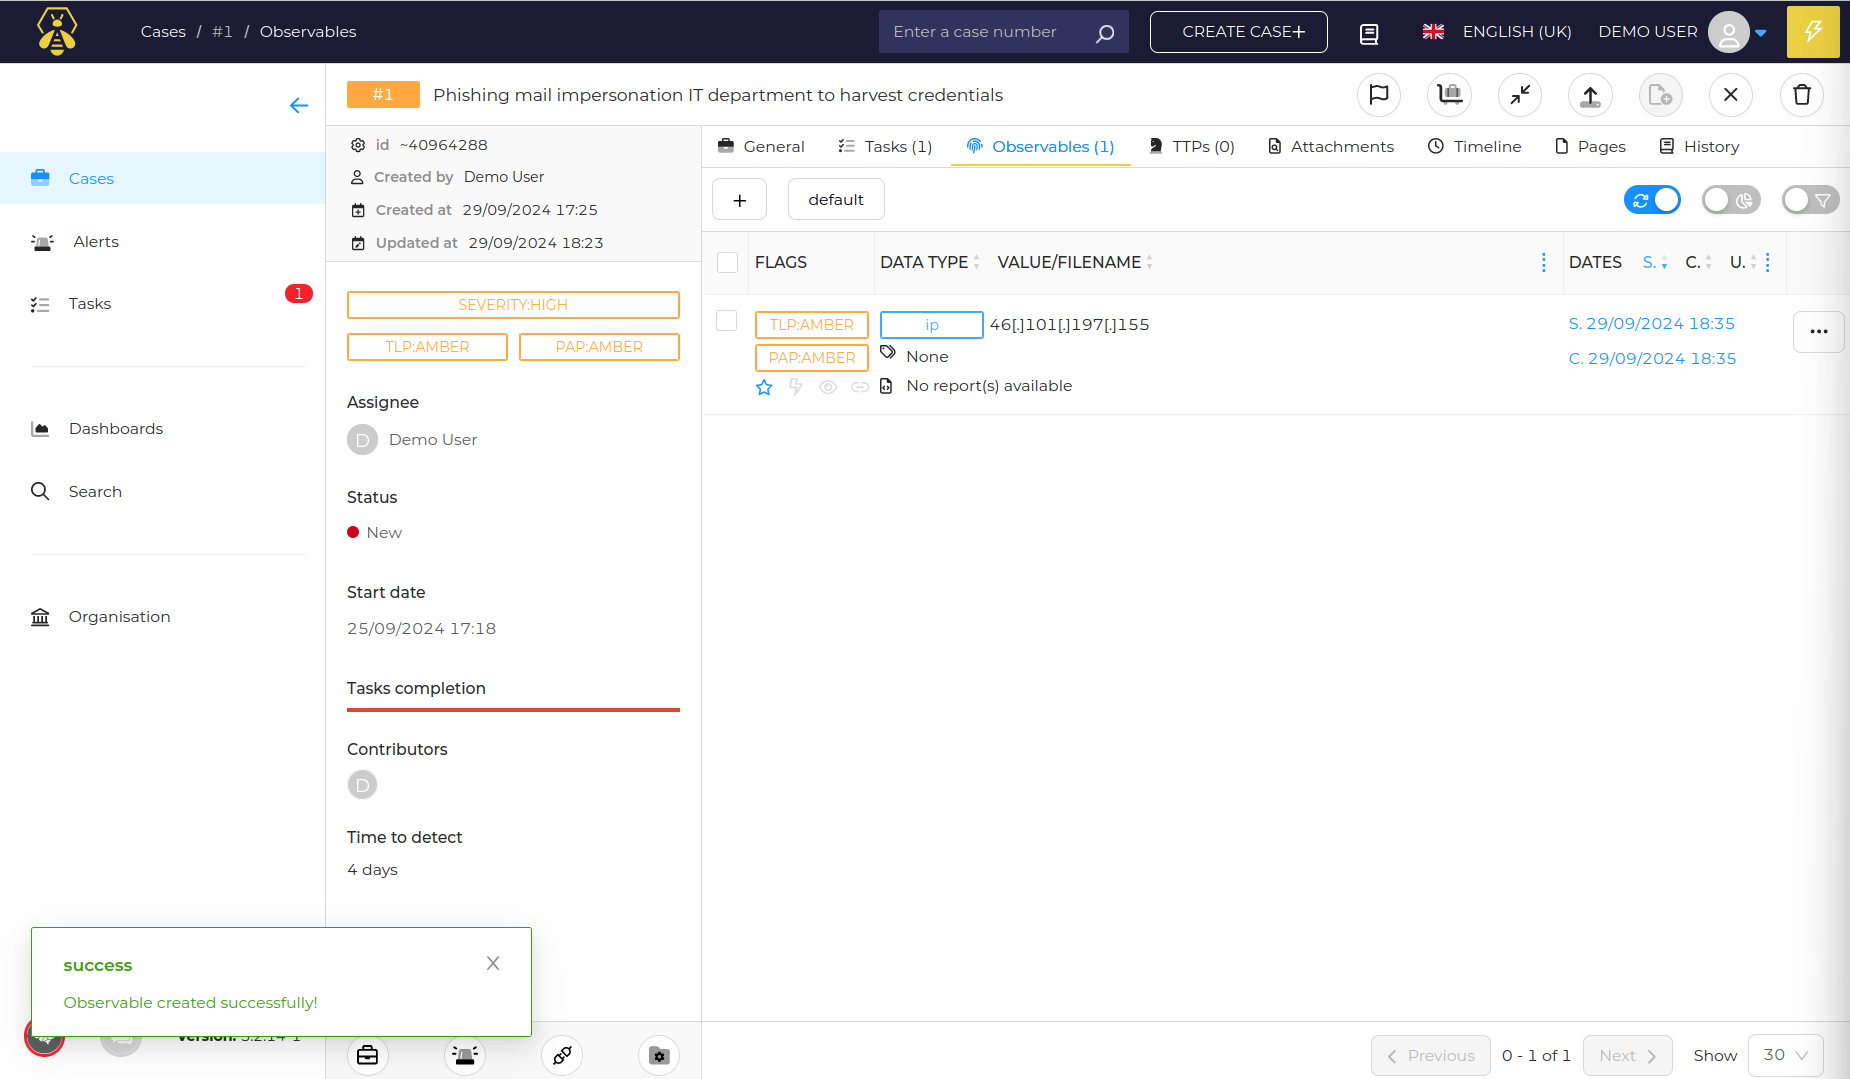
  • Click Save to add it to the case. It now appears in the case's observables list.
TheHive screenshot
The observable now shows under the Observables tab, with a success message.
Close the case

This is the final step. Once every case task is closed, all observables are recorded, and all the work in MISP, Cortex and Mattermost is complete, your team concludes the incident by closing the case in TheHive.

1Open the close dialog
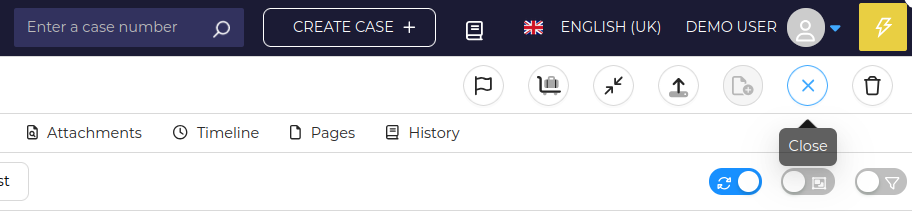
  • With every task and all tool work finished, click the Close (X) button in the case toolbar at the top right.
TheHive screenshot
The case toolbar. The Close (X) button on the right closes and resolves the whole case.
2Resolve the case
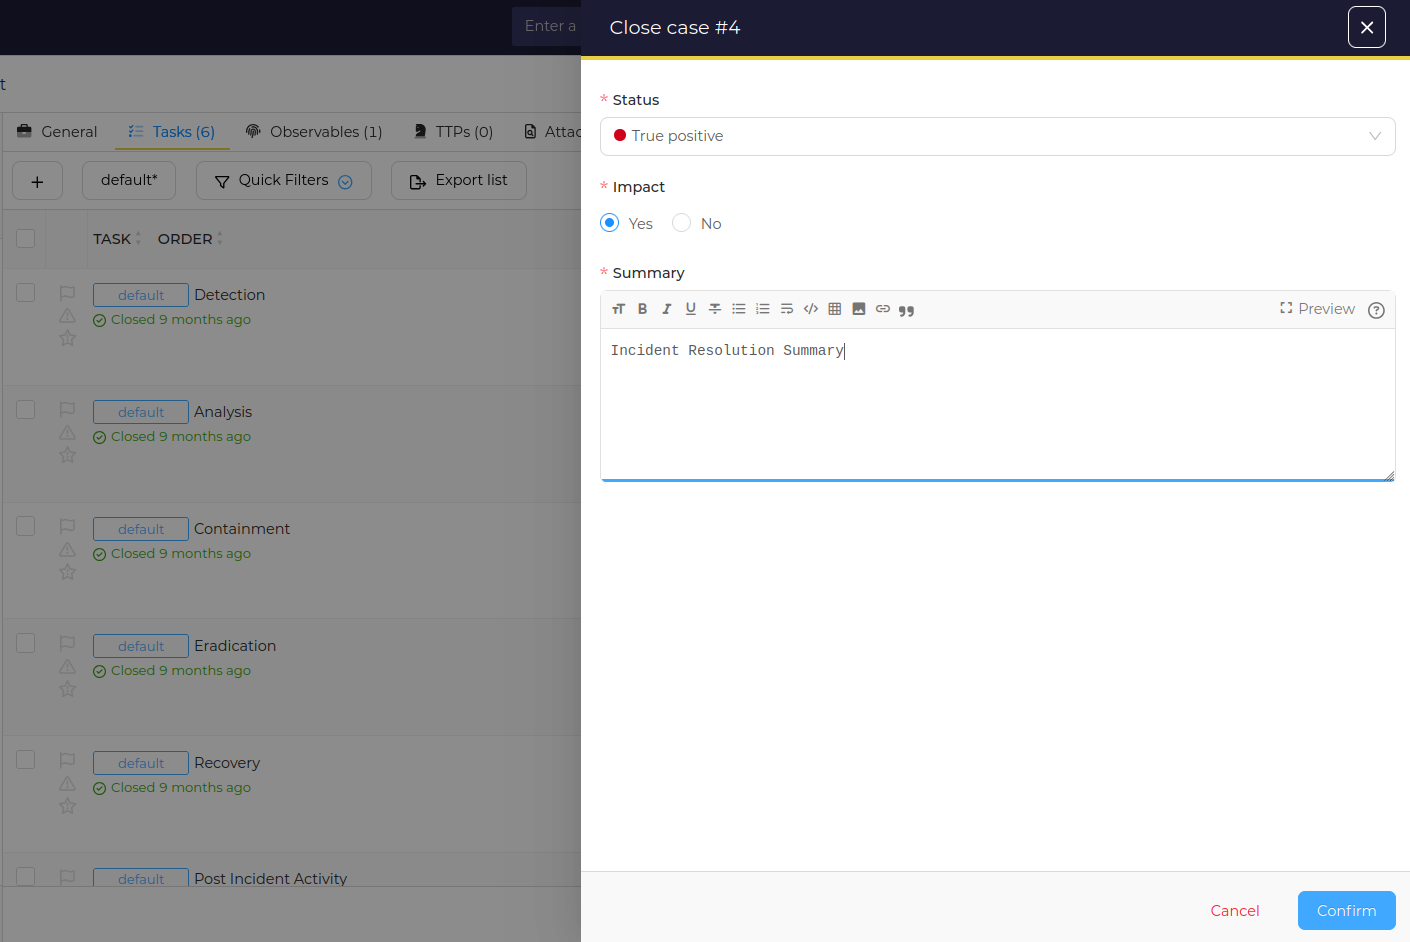
  • Status: pick the resolution, such as True positive.
  • Impact: choose whether there was impact.
  • Summary: write the incident resolution summary.
  • Click Confirm. The case is now closed and resolved.
TheHive screenshot
The Close case dialog: set the Status, Impact and a resolution Summary, then Confirm.
Good to know. Org admins manage users, case templates and the org. Read access members can view and comment but not change case structure.
port 8080Threat intelligence sharing

Correlate IoCs for threat intelligence data. Create security events and add your indicators as attributes. All four teammates are org admins.

Create an event
1Navigate to the Events section
  • Log in to MISP with your responder account.
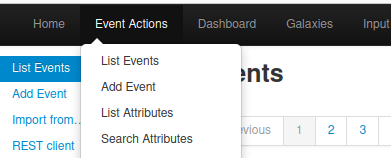
  • Open the Event Actions menu and choose Add Event.
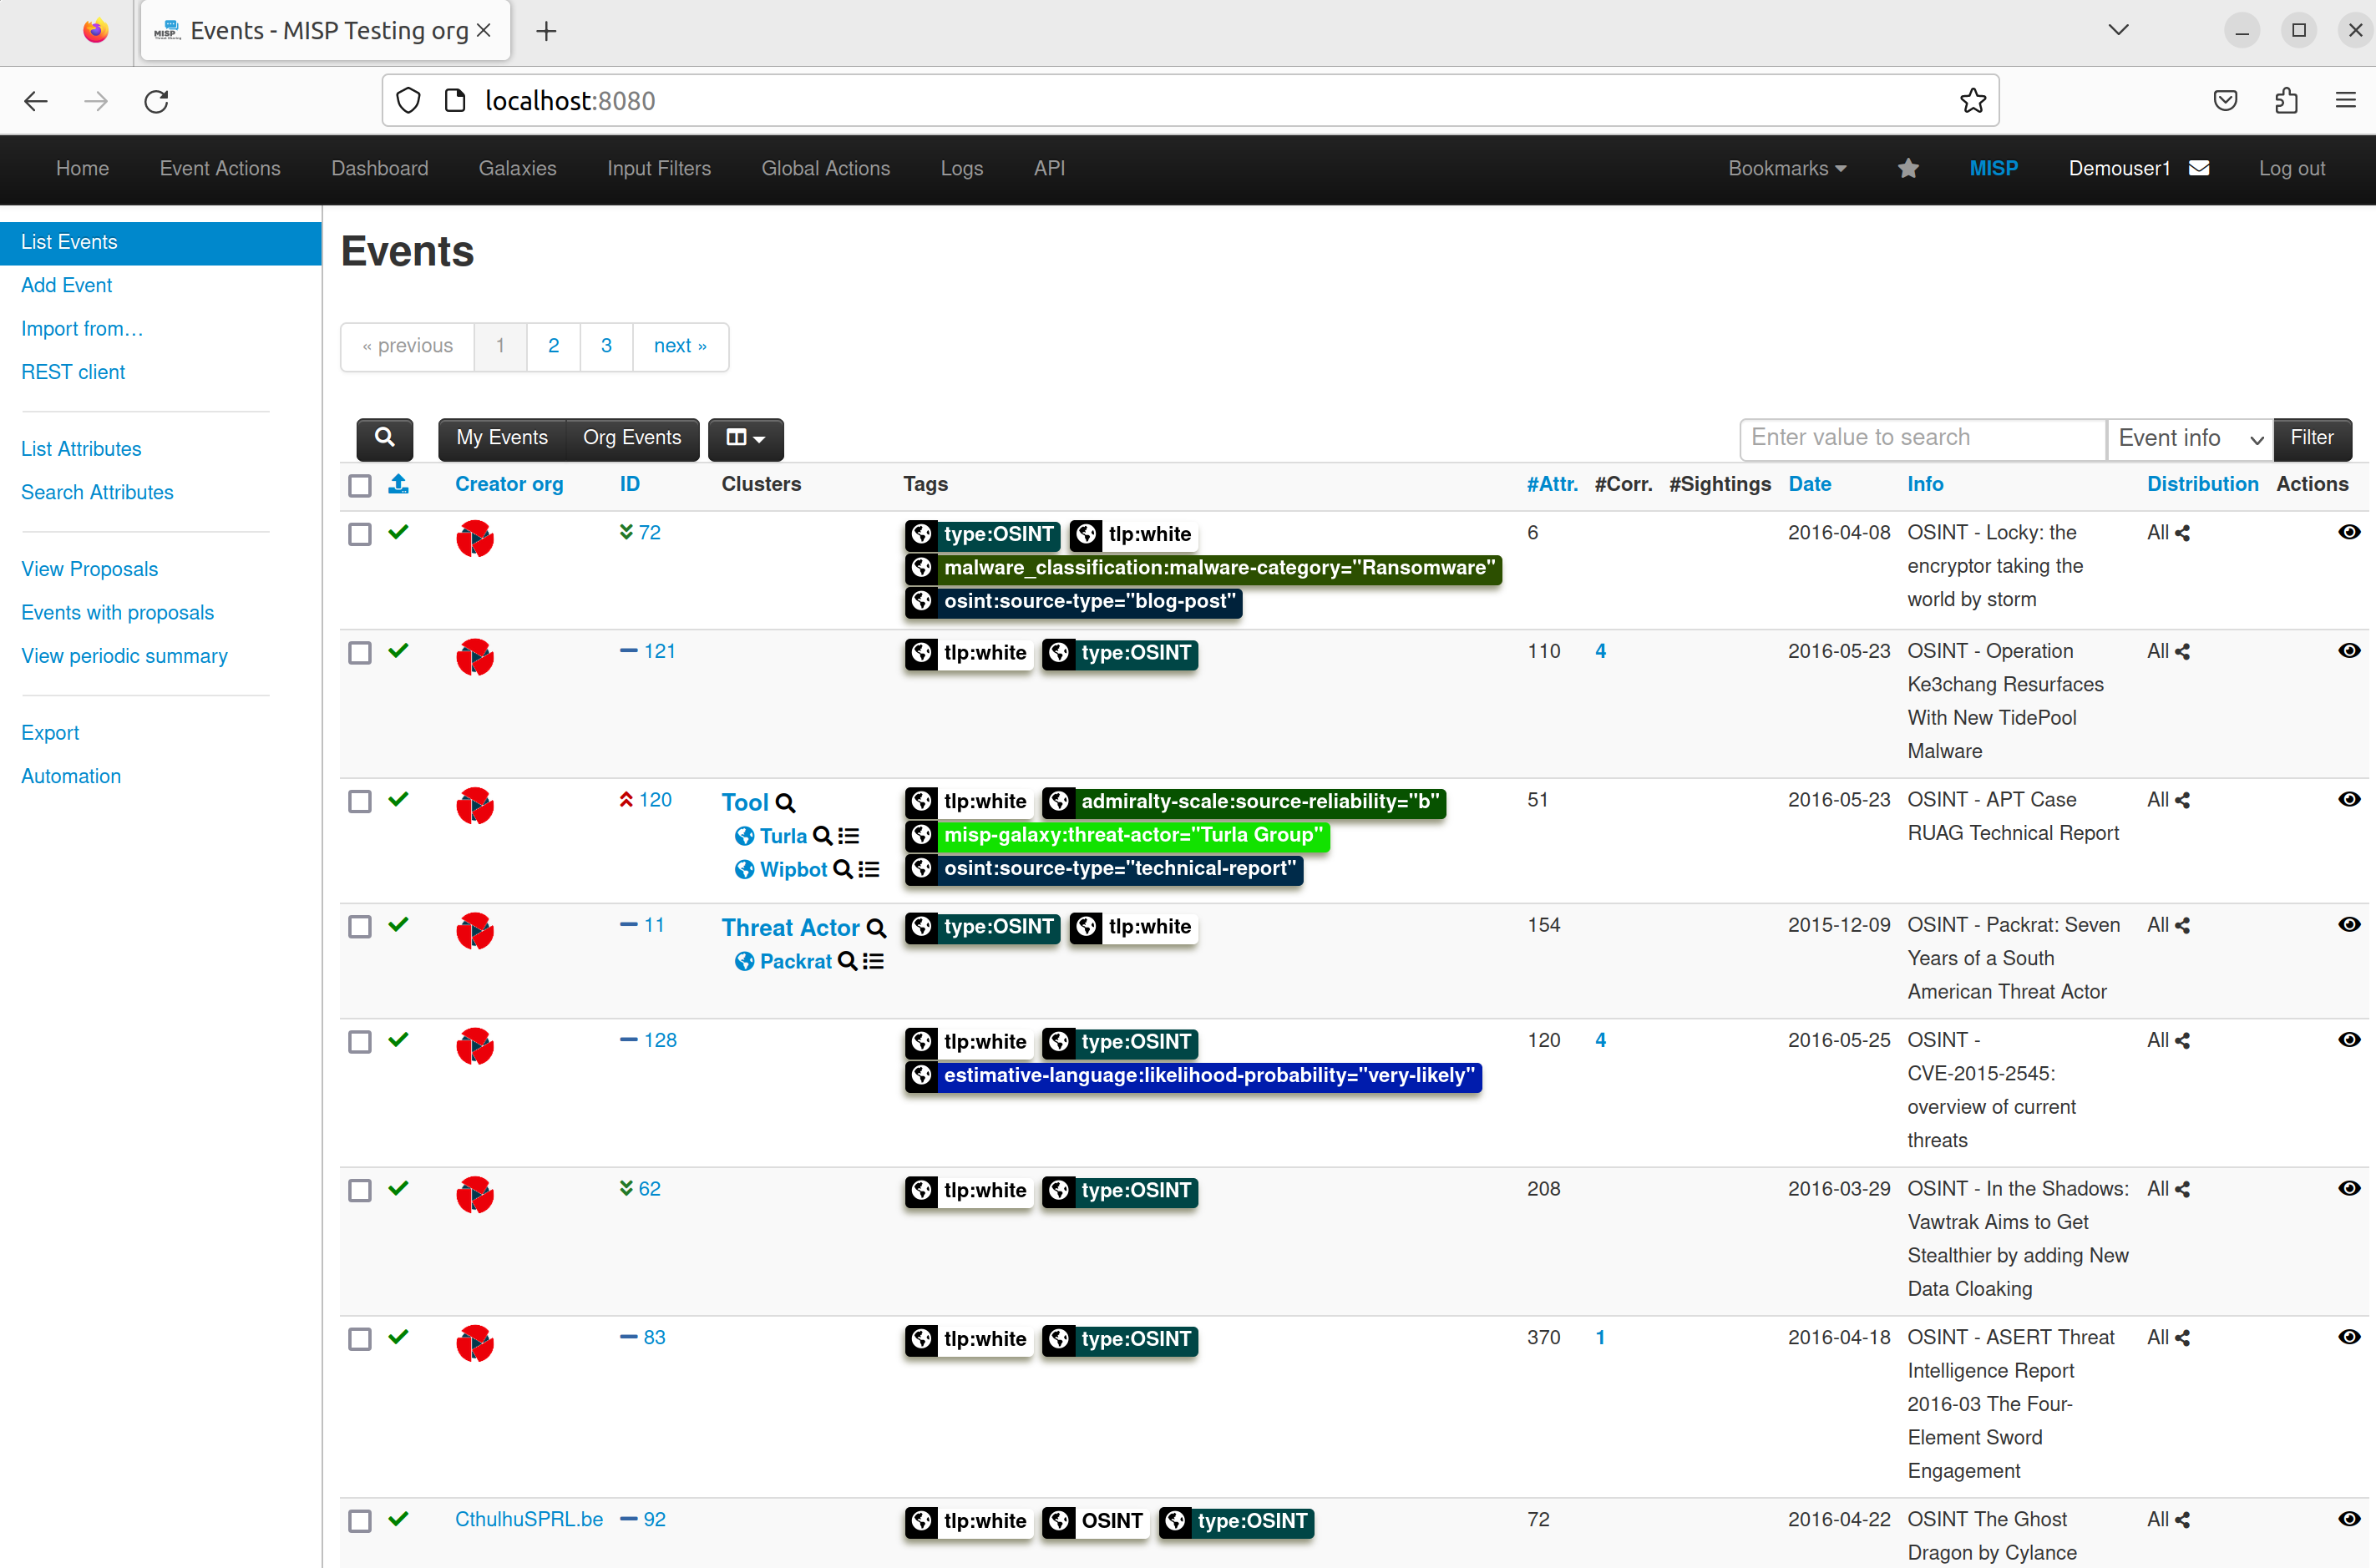
MISP screenshot
The Events list. Existing events show their tags, attribute counts and correlations.
MISP screenshot
The Event Actions menu at the top. Choose Add Event to open the new event form.
2Fill in the event details
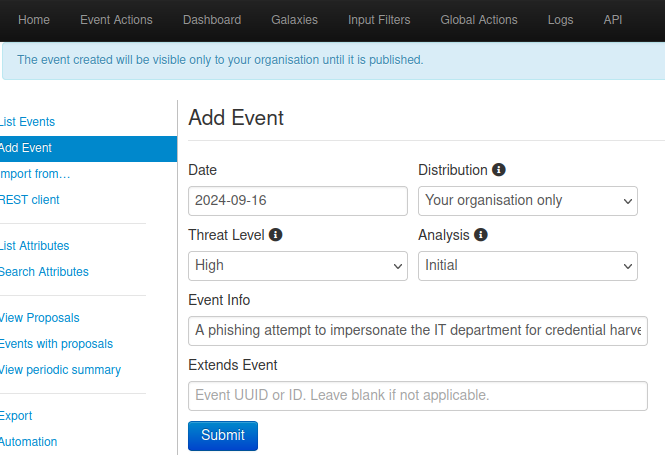
  • Enter the Event Info, Distribution, Analysis, and Threat Level.
  • Click Submit.
MISP screenshot
The Add Event form. Set the Date, Distribution, Threat Level and Analysis, enter the Event Info, then Submit.
MISP screenshot
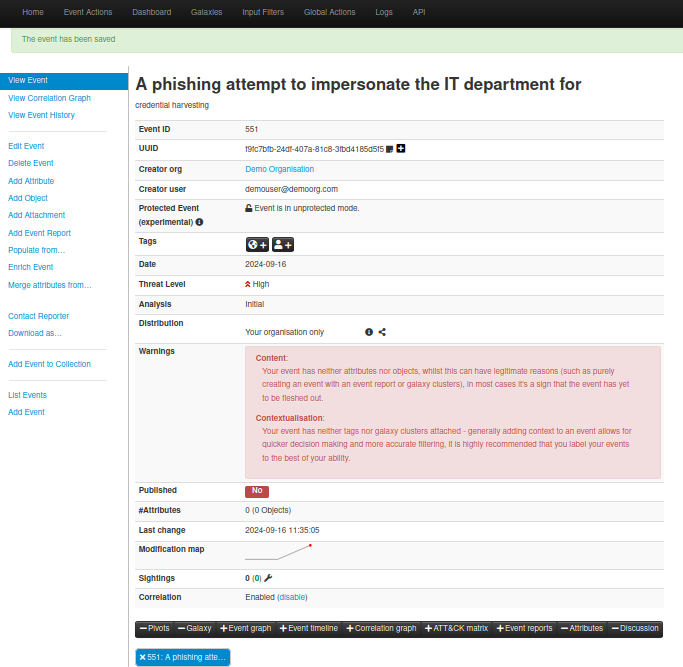
The saved event view. The left menu now has Add Attribute for the next step.
Add attributes
1Add attributes
  • After saving the event, you land on the event view.
  • Click Add Attribute in the left menu, fill in the details, and submit.
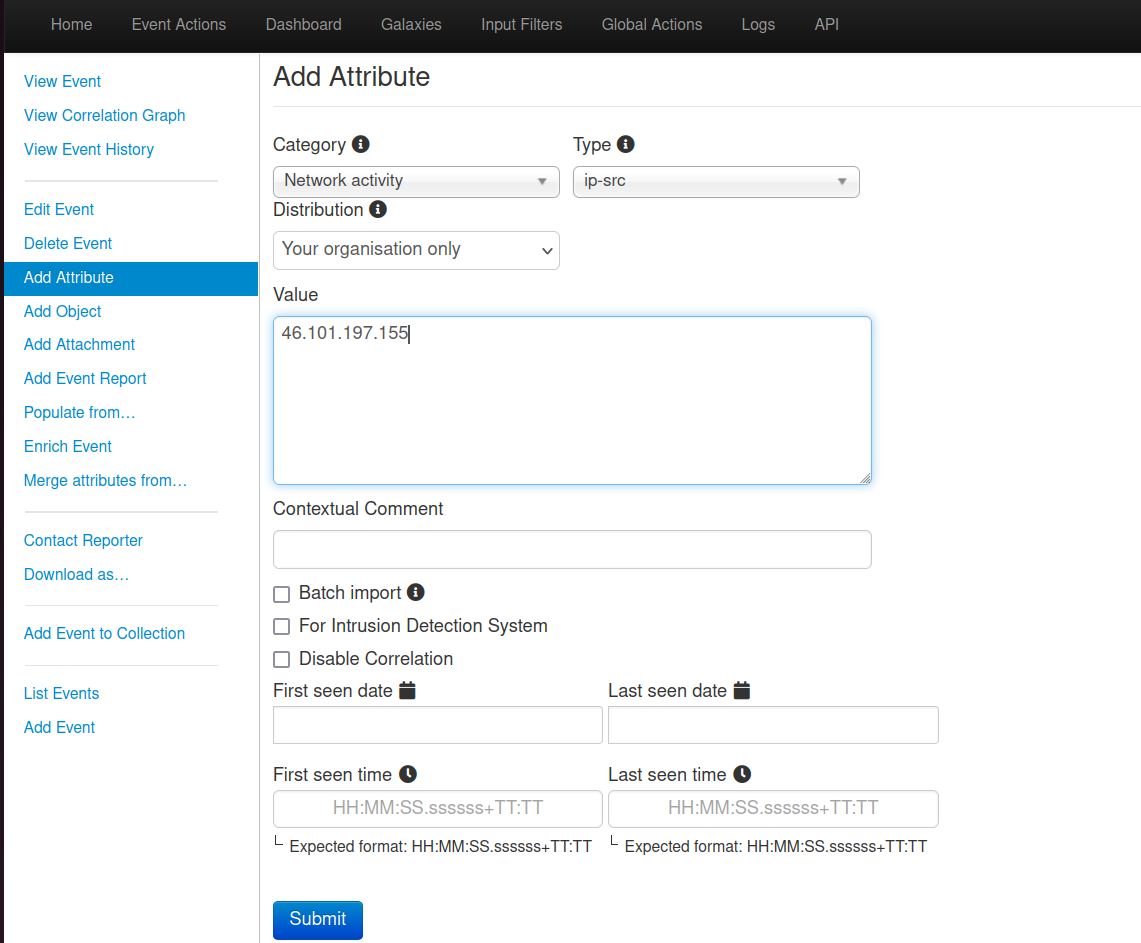
MISP screenshot
The Add Attribute form. Pick the Category and Type, set Distribution, enter the Value, then Submit.
MISP screenshot
The new attribute now listed under the event, with its category, type, and value.
Good to know. Keep distribution tight in the lab (your organisation only).
port 9001Observable analysis

The enrichment engine. It runs analysers against observables. All four teammates are org admins here.

Run a new analysis
1Navigate to New Analysis
  • On the top left of the menu pane, click + New Analysis.

Cortex screenshot
The Cortex top bar. New Analysis is on the left; Jobs History, Analyzers and Responders are on the right.
2Fill in the required information
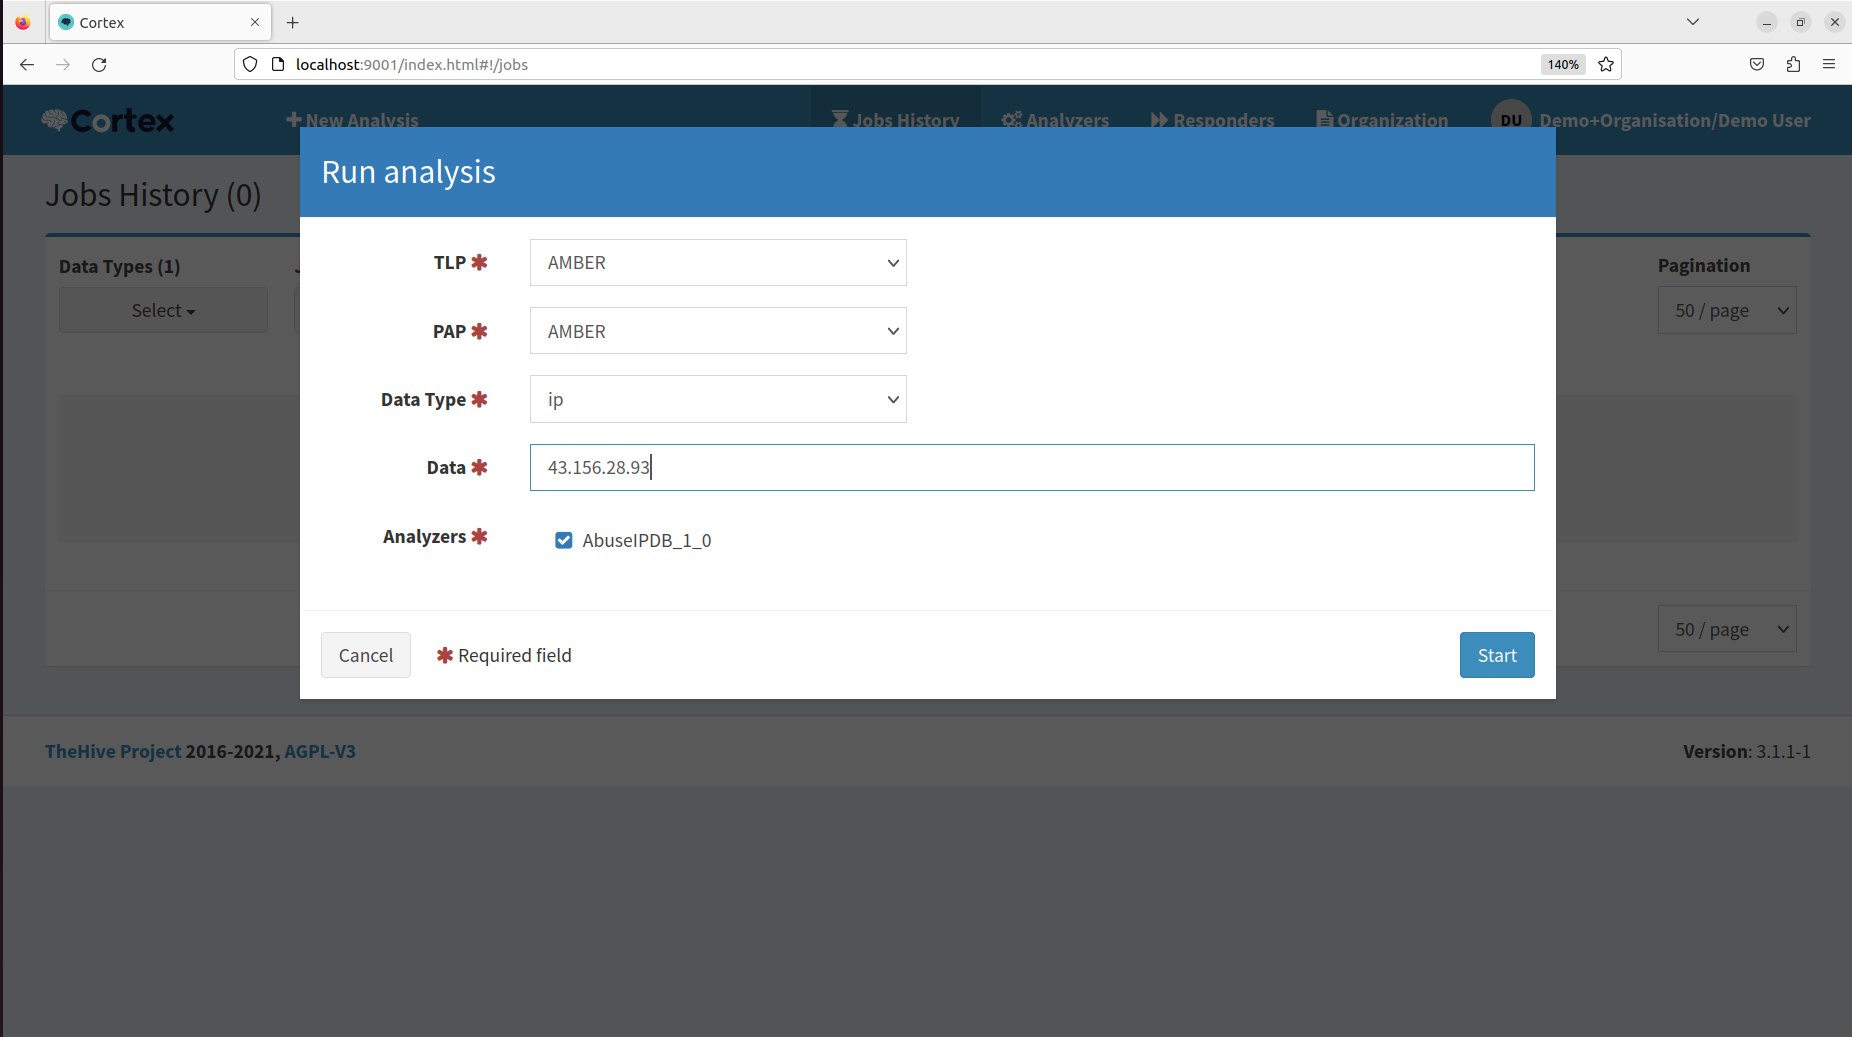
  • TLP: how the analysis results can be shared.
  • PAP: what actions can be taken with the results.
  • Data Type: select IP from the dropdown so Cortex knows the observable is an IP address.
  • Data: type the IP address you want to analyse.
  • Analyzer: select the analyzer to run.
Cortex screenshot
The Run analysis dialog. Set TLP and PAP, choose the Data Type (IP), type the IP in Data, tick the analyzer to run, then Start.
3Run the analysis
  • Click Start to begin. Cortex runs the selected analyzer on the IP address.
  • Click View to see the analysis details.
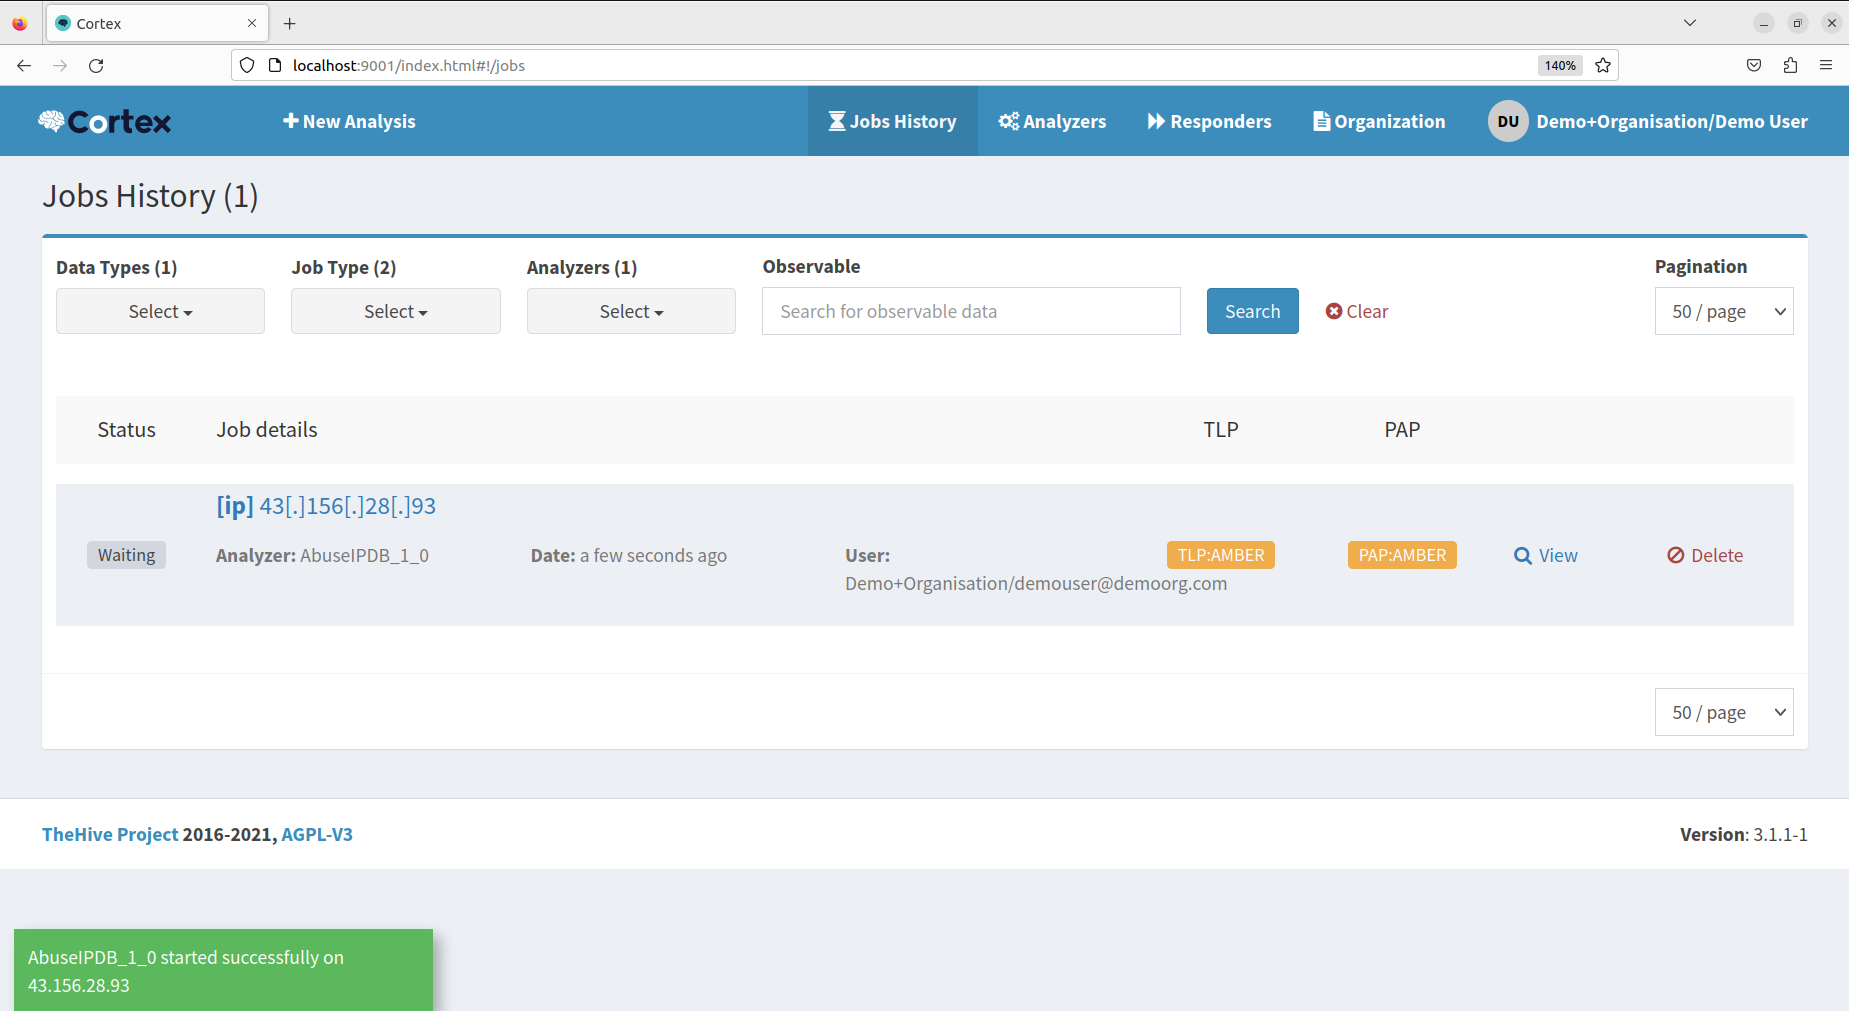
Cortex screenshot
The job appears in Jobs History with a Waiting status and a started successfully message.
Cortex screenshot
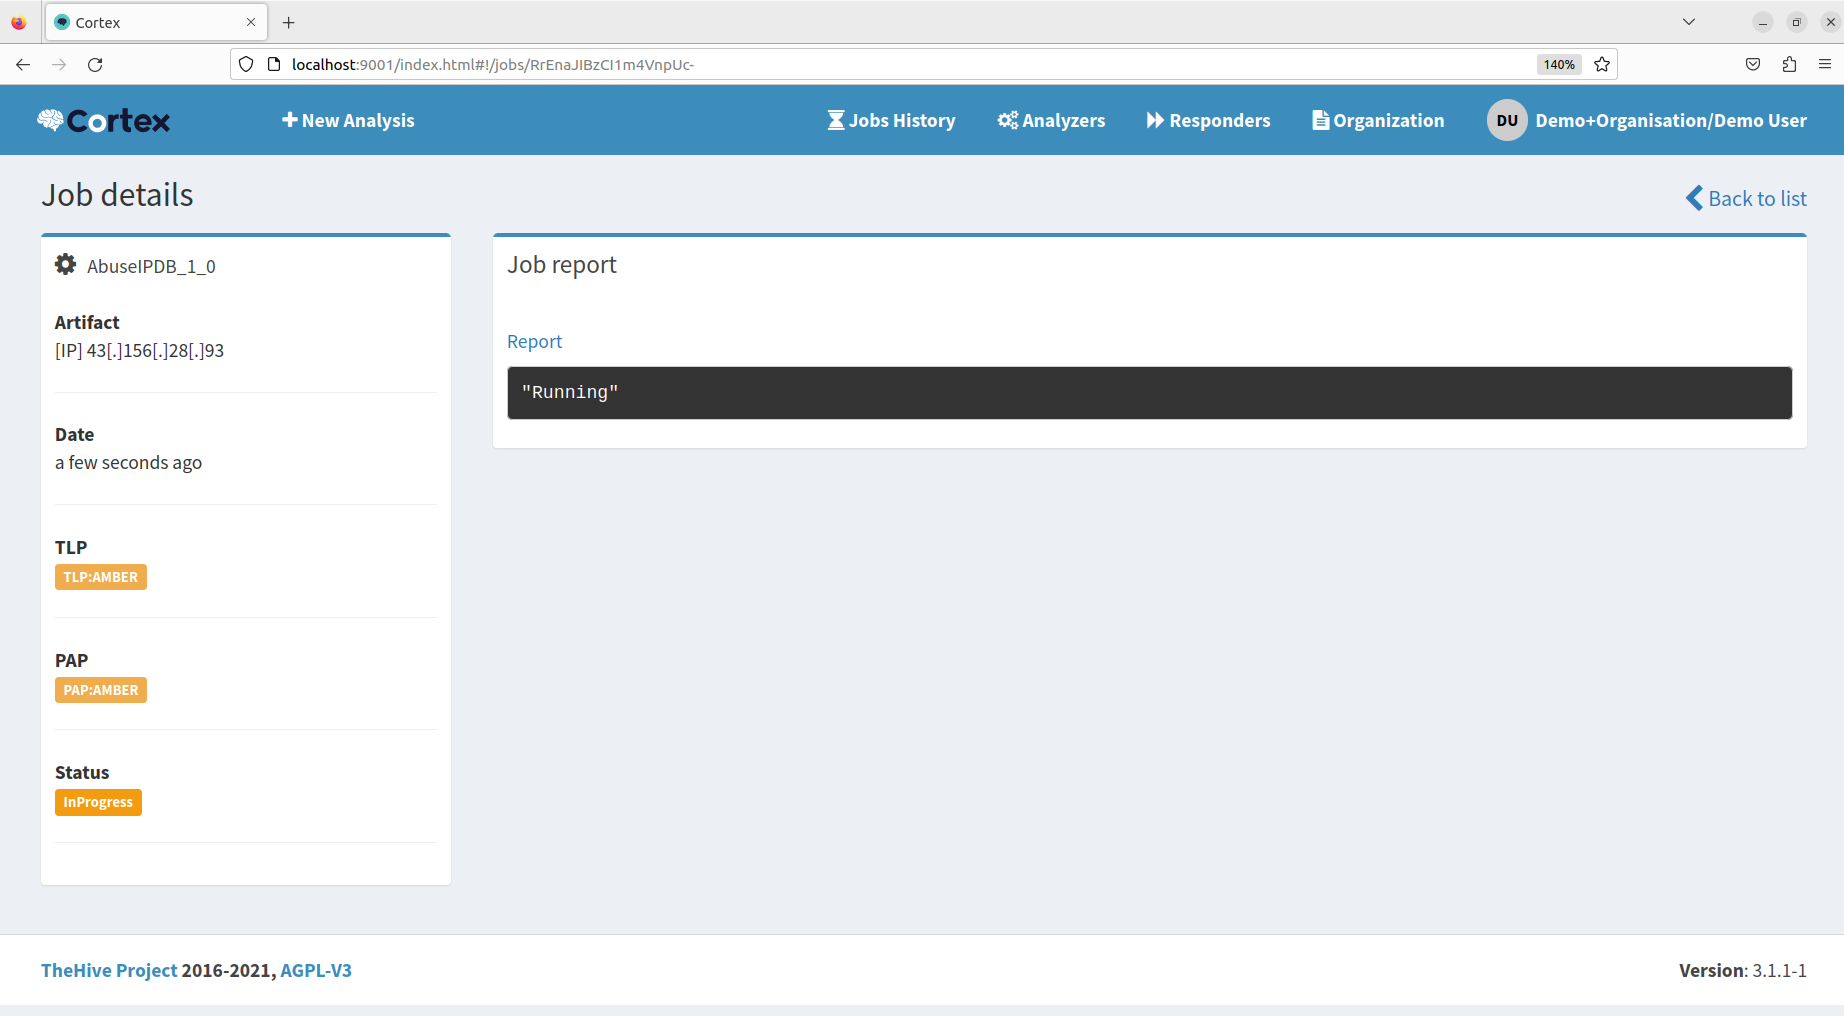
Clicking View opens the job details while the analyzer runs, with the status shown as In Progress.
Monitor and view results
1Navigate to Jobs History
  • On the top left of the menu pane, click Job History. Each job is listed with a status such as Waiting, In Progress, or Success.
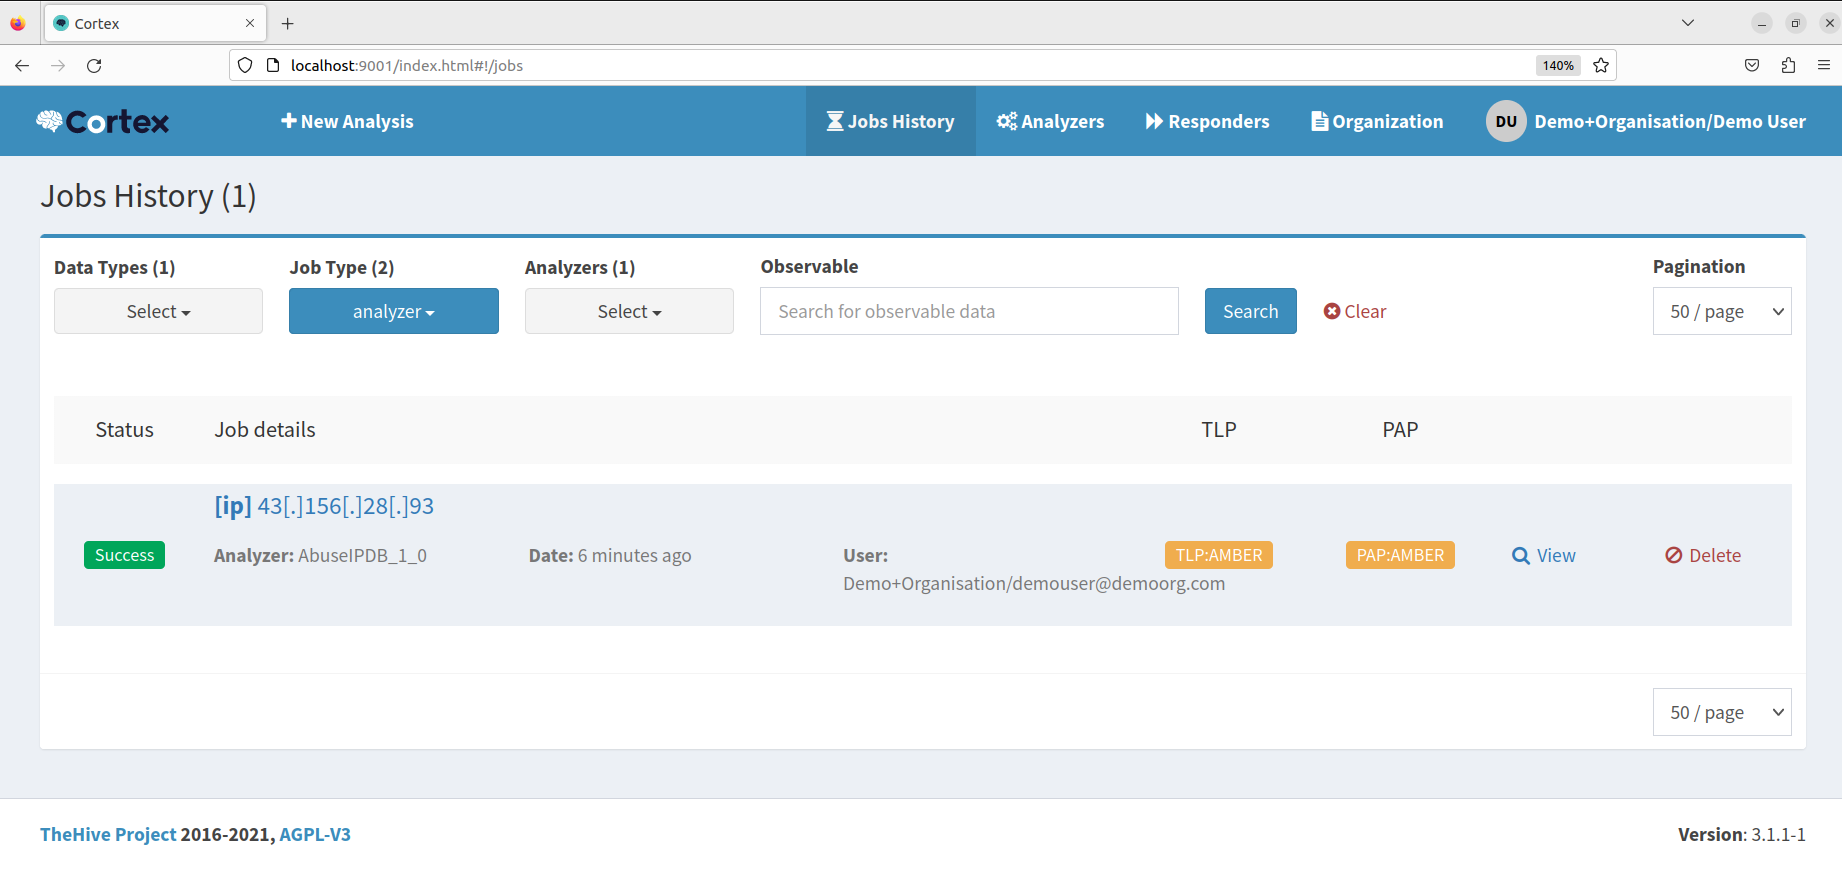
Cortex screenshot
Back in Jobs History, the job status changes to Success. Click View to open the report.
2View the analysis results
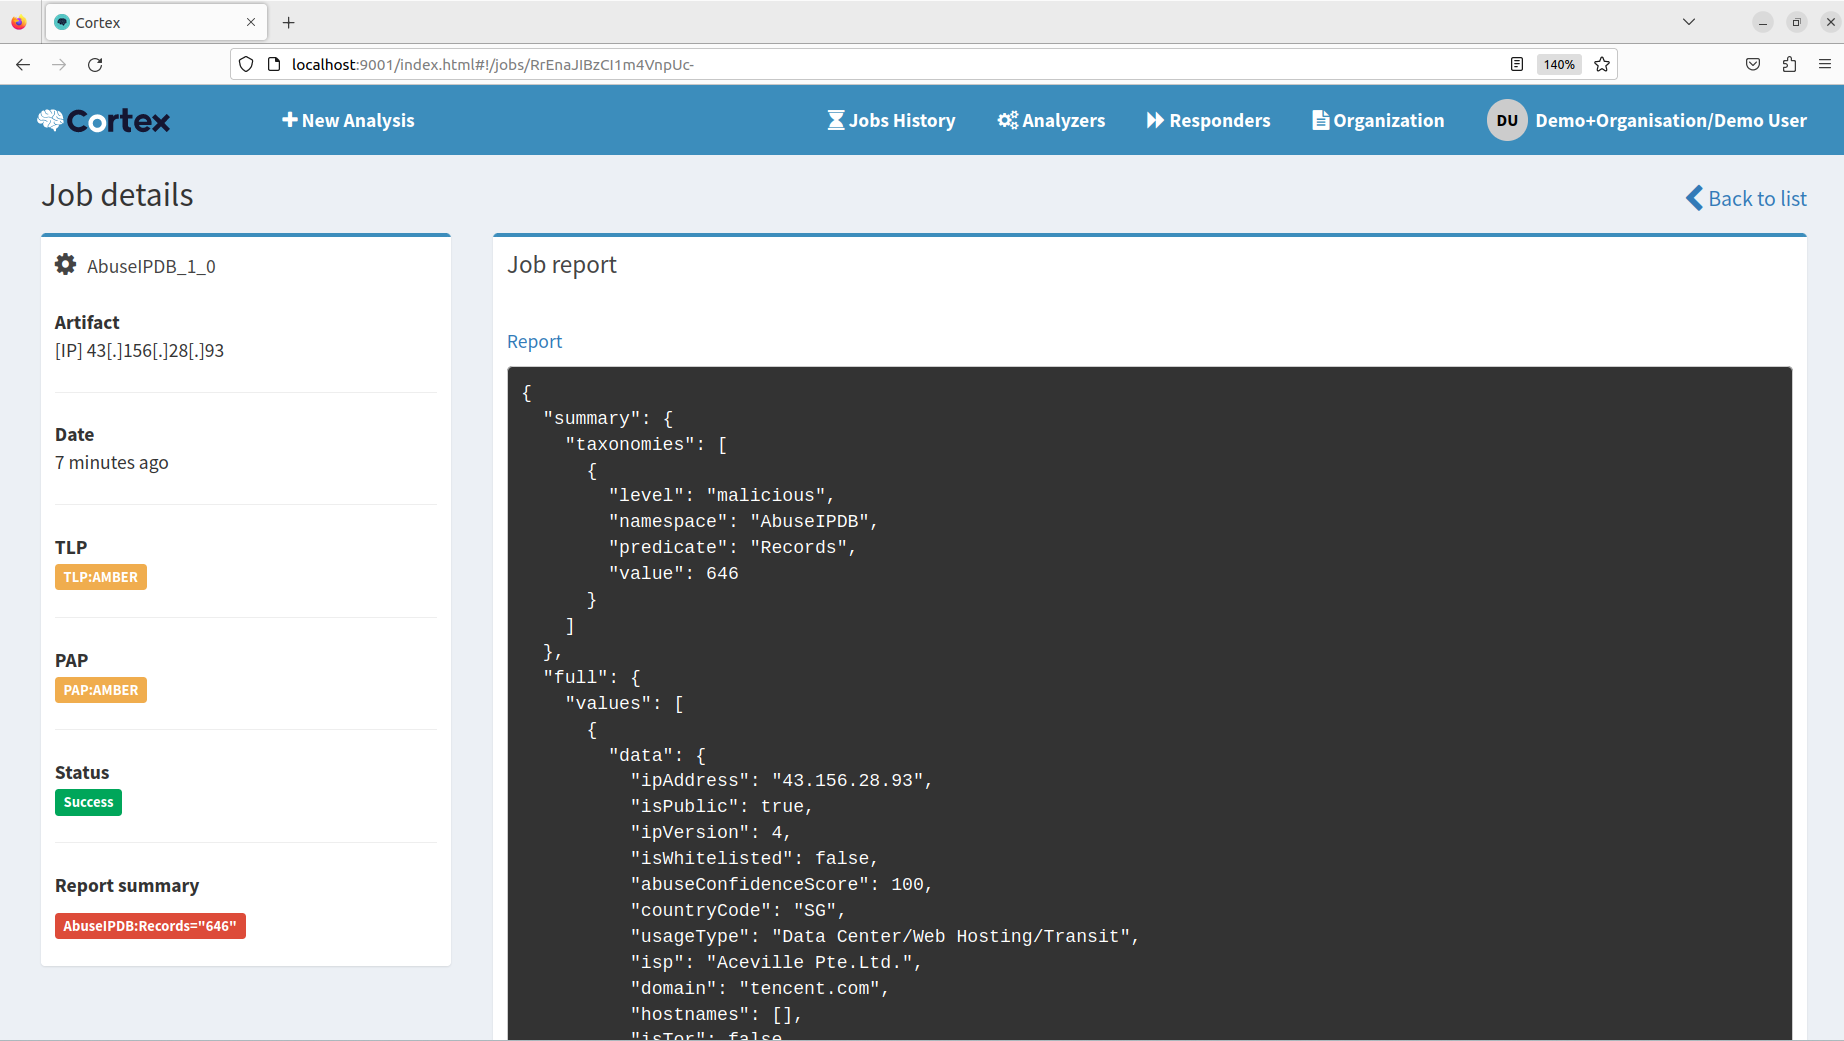
  • When the status changes to Success, click the job to open the detailed results page. The analyzer's report shows detailed intelligence on the observable.
Cortex screenshot
The finished AbuseIPDB report, with a taxonomy summary and the full JSON findings.
Cortex screenshot
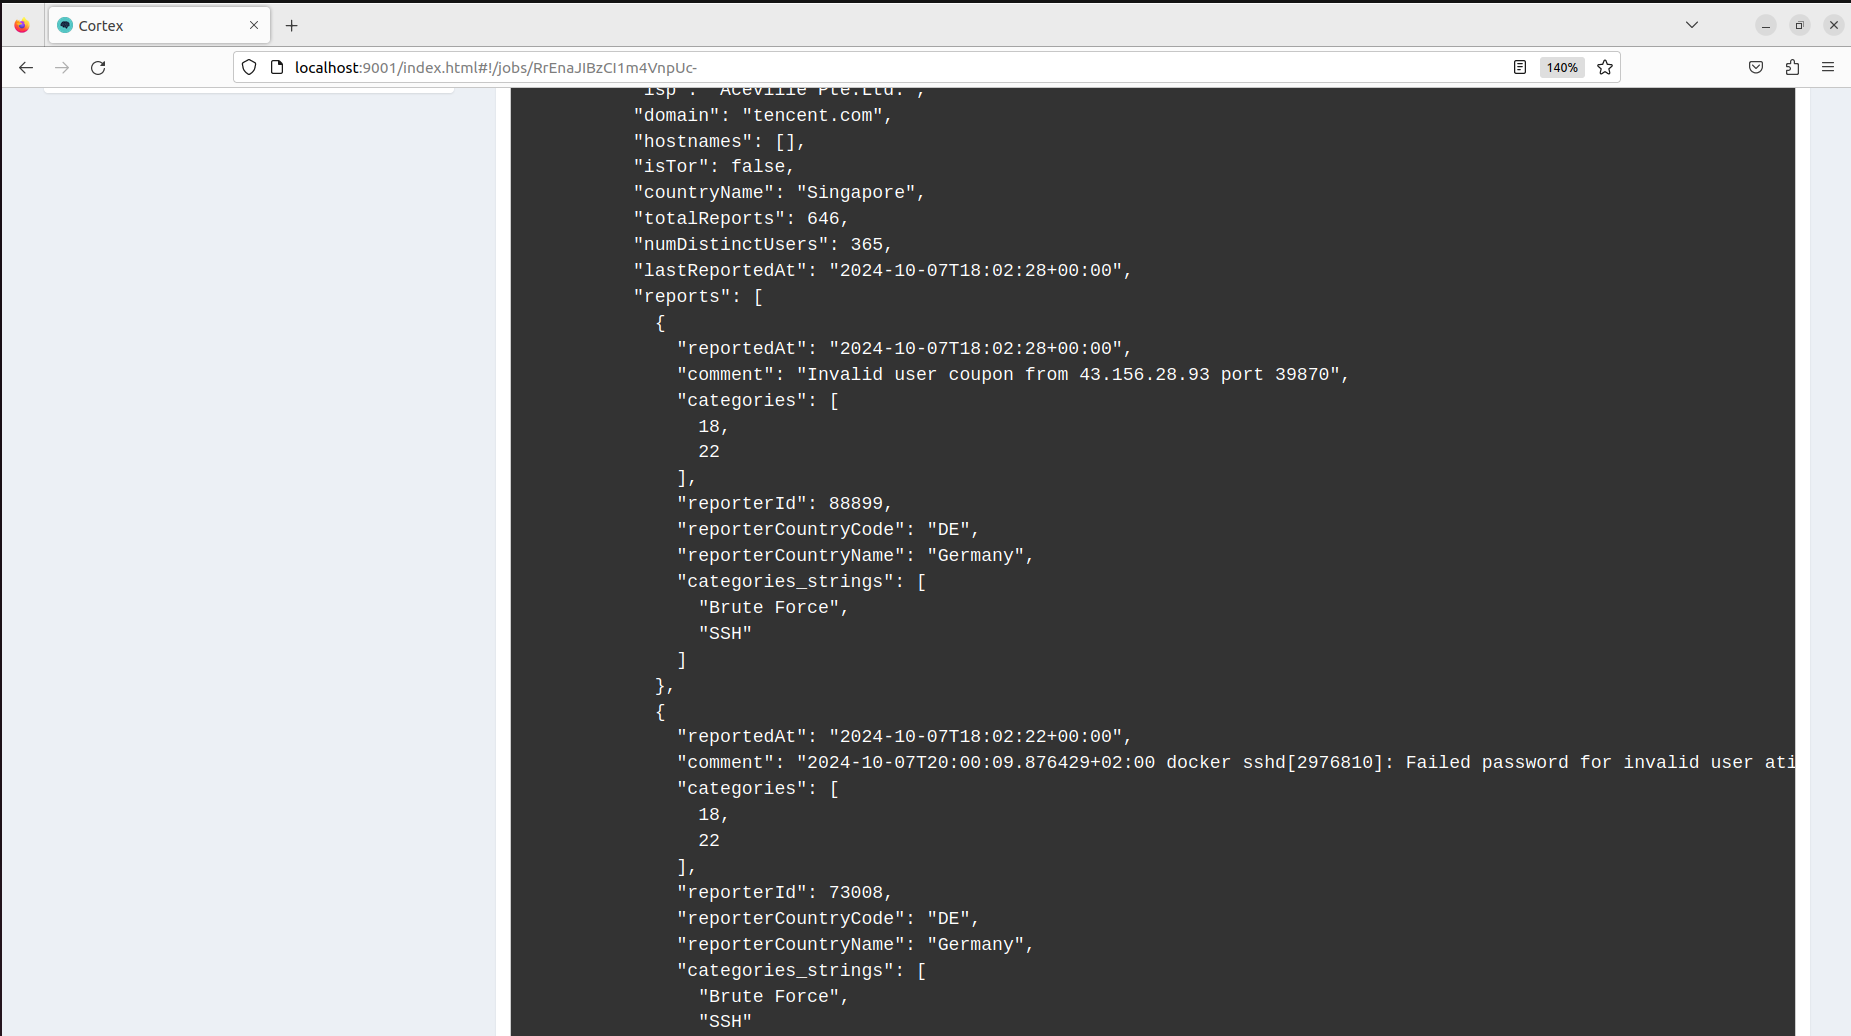
Scrolling the report shows the individual abuse reports, including source countries and categories.
Good to know. Analyzers have already been configured for you, so you can just kick start your analysis.
port 8065Team chat & coordination

Your teams communication channel during an incident.

Getting started
  • Log in with your responder email (your username is responder<NN>) and password.
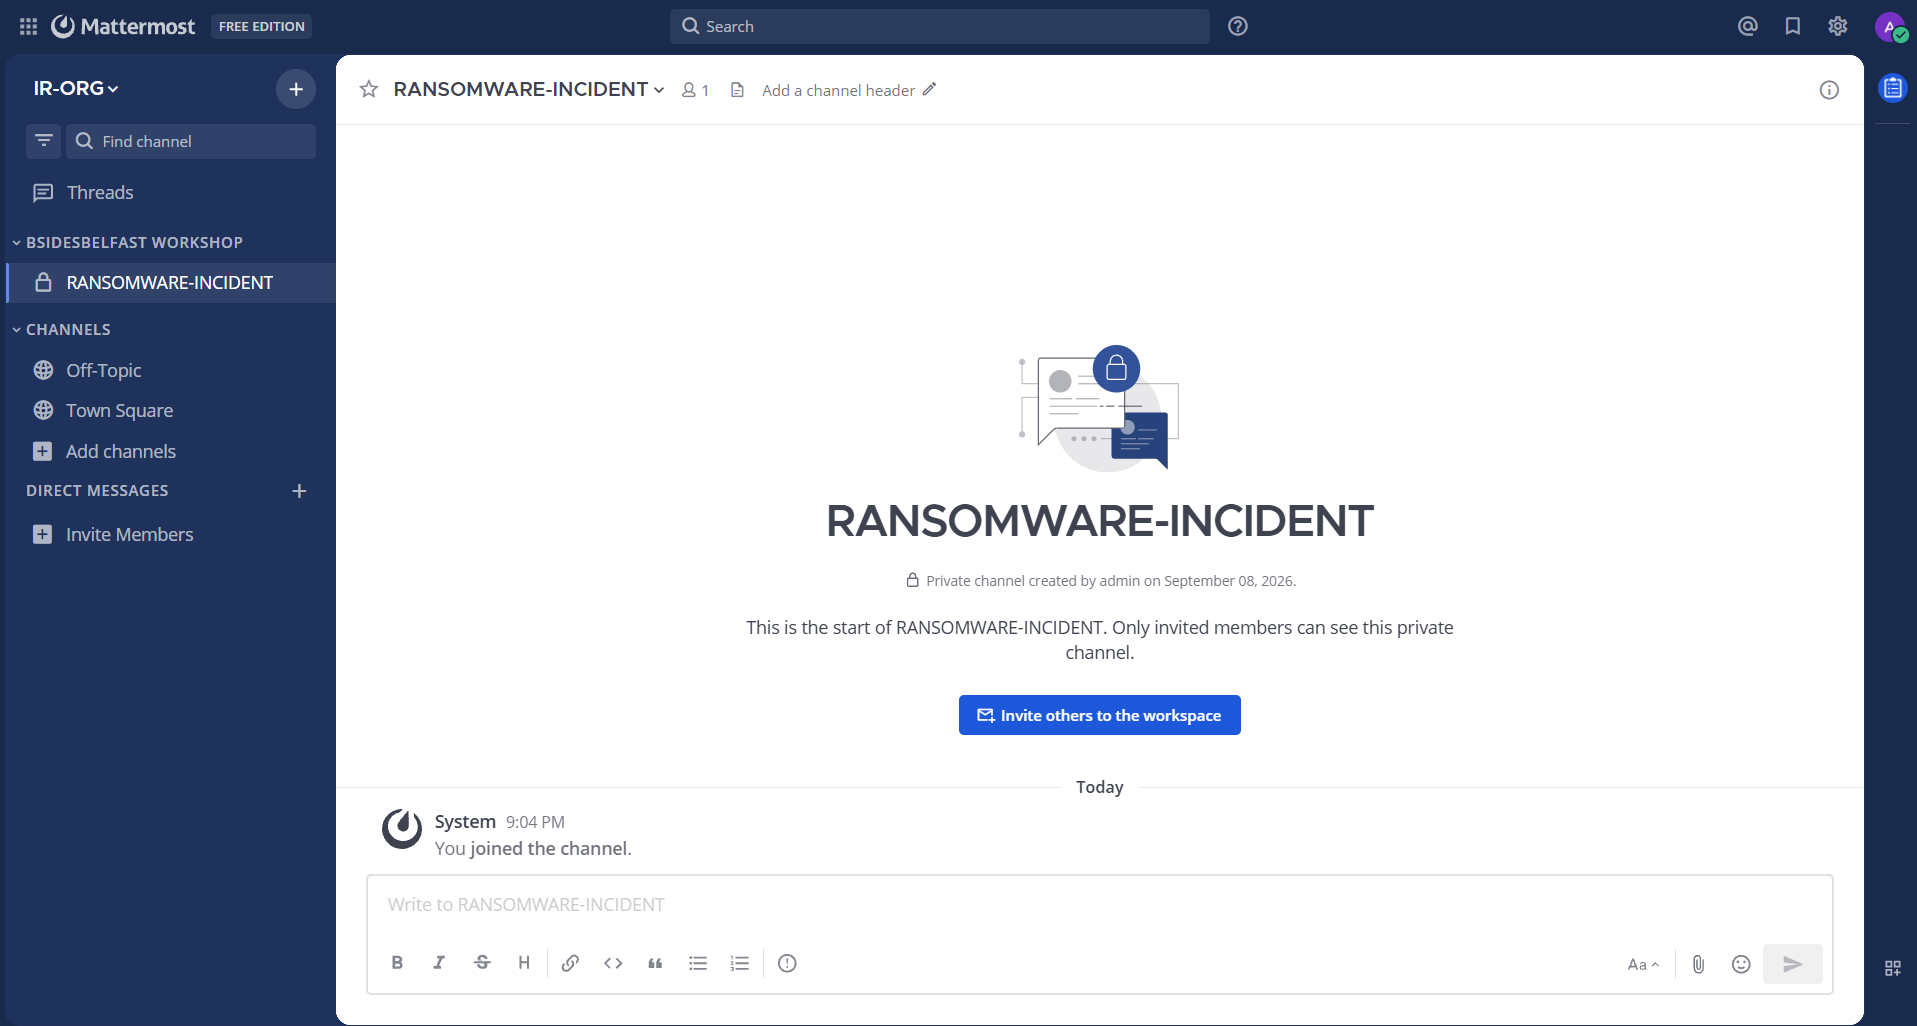
  • Join and communicate through your team channel named "RANSOMWARE-INCIDENT"
Mattermost screenshot
Channel to use during communication with team members during workshop
Good to know. Your login is your email, but your displayed username is responder<NN>